Category: Uncategorized

  • Brexit 2016 – The ‘Last’ Referendum?


    1. Long-Term Background: The UK and European Integration, 1973 to 2013

    The UK joined the European Economic Community in January 1973 under Edward Heath’s Conservative government, having applied for membership twice before and been vetoed by France.

    Divisions over Europe surfaced almost immediately: Harold Wilson’s Labour government held a referendum in 1975 on continued membership, partly to manage deep splits within his own party, and the result was a decisive 67.2% vote in favour of staying in, on a turnout of 64.5%.

    Divisions over Europe re-emerged more seriously within the Conservative Party from the late 1980s onwards, particularly after the Maastricht Treaty of 1992 deepened European integration and provoked sustained backbench rebellions against John Major’s government.

    The UK Independence Party, founded in 1993, gave organisational form to growing Euroscepticism, though for many years it remained electorally marginal. Europe became increasingly entangled with debates over immigration after the 2004 enlargement of the EU, which extended free movement rights to citizens of Poland and other new member states.

    By the early 2010s, UKIP’s support had grown substantially, culminating in the party topping the poll in the 2014 European Parliament elections, the first time a party other than Labour or the Conservatives had won a UK-wide election in over a century.


    2. Short-Term Background: From Coalition to Referendum, 2010 to 2016

    The Conservative-Liberal Democrat Coalition, formed after the 2010 general election, complicated any immediate referendum commitment, since the Liberal Democrats were consistently the most pro-European of the major parties. Pressure built on David Cameron from Eurosceptic backbenchers and from UKIP’s electoral advance.

    On 23 January 2013, in a speech at Bloomberg’s London offices, Cameron pledged that, if the Conservatives won a majority at the next general election, his government would renegotiate the terms of UK membership and then hold an in/out referendum by the end of 2017. This pledge was repeated in the Conservative Party’s 2015 general election manifesto.

    Having won a majority in May 2015, Cameron’s government secured passage of the European Union Referendum Act 2015, authorising the vote.

    Renegotiation talks with EU partners covered four broad areas: economic governance, competitiveness, an exemption from the EU’s commitment to ‘ever-closer union’, and restrictions on welfare payments to EU migrants.

    After a European Council summit in Brussels on 18 and 19 February 2016, a deal was agreed, described as a new settlement for the UK within the EU, though widely judged by commentators to be more modest than Cameron had originally sought.

    On 20 February 2016, Cameron announced the referendum date, 23 June 2016, and confirmed that Cabinet ministers would, unusually, be free to campaign on either side of the question rather than being bound by collective responsibility.


    3. Why Cameron Called the Referendum
    • To manage long-standing and deepening divisions within the Conservative Party over Europe, an issue that had troubled every Conservative leader since the late 1980s.
    • To neutralise the electoral threat posed by UKIP, which had drawn support and votes away from the Conservatives, most visibly in the 2014 European Parliament elections.
    • To fulfil a specific manifesto commitment made in 2015, which had itself been designed to reassure Eurosceptic voters and backbenchers ahead of that election.
    • In the hope that a renegotiated settlement, endorsed by a referendum, would settle the European question for a generation, drawing an implicit parallel with the effect of Wilson’s 1975 referendum on Labour’s internal divisions.
    • Because he and his closest advisers were confident that the economic risks of leaving would ultimately persuade a majority of voters to back continued membership of a reformed EU.

    4. The Campaign: Groups, Messages and Arguments

    The campaign groups

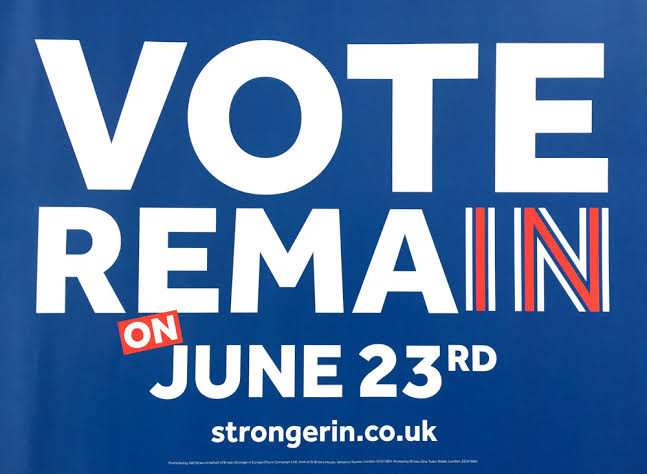
    On 13 April 2016, the Electoral Commission designated Vote Leave and Britain Stronger in Europe as the official lead campaigns for Leave and Remain respectively, giving each a higher spending limit of £7 million, a free mailshot to households, referendum broadcasts and public funding.

    Vote Leave had been founded in October 2015 by the campaign strategists Matthew Elliott and Dominic Cummings, was chaired by the Labour MP Gisela Stuart, and beat a rival bid for designation from Grassroots Out, a group backed by Nigel Farage and UKIP.

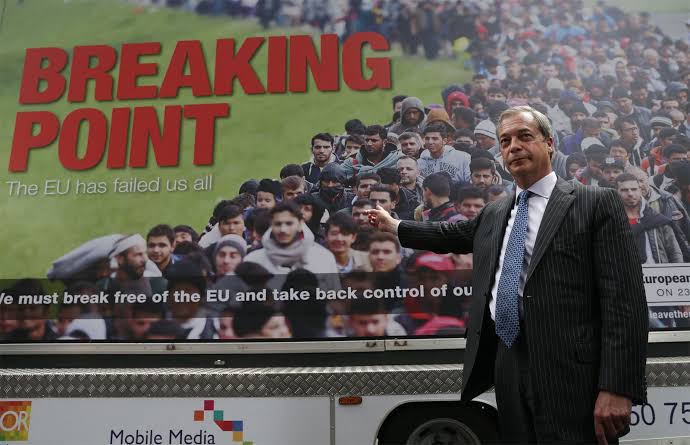
    Farage instead continued to campaign through Leave.EU and Grassroots Out, giving the Leave side two distinct strands: Vote Leave’s cross-party, deliberately ‘positive’ message with less emphasis on immigration, and Farage’s more immigration-focused, populist campaigning.

    Britain Stronger in Europe, launched in October 2015 and chaired by the businessman Stuart Rose, led the Remain campaign, working closely with the government’s own communications operation and supported by most Labour MPs, organised separately as Labour In for Britain under Alan Johnson, as well as the Liberal Democrats, the SNP, Plaid Cymru and the majority of large business organisations.

    The Leave case

    • Sovereignty and control: the slogan ‘Take Back Control’ argued that EU membership meant that laws, borders and money were controlled from Brussels rather than by the UK Parliament.
    • Immigration: ending the free movement of people within the EU would allow the UK to set its own rules on the number and type of immigrants it admitted.
    • Money: the widely publicised claim, displayed on the Vote Leave campaign bus, that the UK sent £350 million a week to the EU which could instead be spent on the National Health Service, a figure disputed by statisticians and the UK Statistics Authority as misleading because it took no account of the rebate and the funds returned to the UK.
    • Trade and global prospects: the argument that the UK could prosper outside the EU by negotiating its own trade deals and would remain an attractive trading partner for the remaining EU states.

    The Remain case

    • Economic risk: warnings, often labelled by opponents as a repeat of ‘Project Fear’ (a term first used during the 2014 Scottish referendum), that leaving the single market would cost jobs, reduce trade and weaken the economy; the Treasury and the Bank of England both published analyses predicting a recession and falling incomes in the event of a Leave vote.
    • Influence and security: the UK’s voice within a bloc of 28 states and continued cooperation on security and counterterrorism.
    • Market access: unrestricted trade with the EU, by far the UK’s largest single trading partner.
    • The risks of withdrawal itself: the difficulty and likely length of negotiating new trading arrangements, and the uncertainty this would create for businesses and investment.
    5. Key Figures

    David Cameron. Conservative Prime Minister from 2010, who had promised the referendum since 2013 and led the campaign for Remain; he announced his resignation the day after the result.

    George Osborne. Chancellor of the Exchequer under Cameron and a prominent Remain campaigner, who warned of an emergency ‘punishment’ Budget of tax rises and spending cuts if the country voted to leave.

    Jeremy Corbyn. Labour leader from September 2015, who nominally backed Remain but was criticised, including by some of his own MPs, for campaigning without great enthusiasm given his own long-standing scepticism about the EU.

    Boris Johnson. former Mayor of London and Conservative MP, who became the most prominent public face of Vote Leave after declaring for Leave in February 2016, a move widely seen as crucial to the credibility of the Leave campaign.

    Michael Gove. Conservative Justice Secretary and a close ally of Cameron, who broke with the Prime Minister to campaign for Leave and provided much of the intellectual and legal case against continued membership.

    Nigel Farage. leader of UKIP and the most prominent Eurosceptic politician of the period, who fronted Leave.EU and Grassroots Out rather than the officially designated Vote Leave campaign and focused heavily on immigration.
    Dominic Cummings. co-founder and campaign director of Vote Leave alongside Matthew Elliott, widely credited as the principal strategist behind the ‘Take Back Control’ slogan and the campaign’s data-led targeting of voters.

    Arron Banks. insurance businessman and UKIP donor who provided the bulk of the funding for Leave.EU, the rival Eurosceptic campaign fronted by Farage; the Electoral Commission later fined Leave.EU over its spending return and referred Banks to the National Crime Agency over the source of an £8 million loan, an investigation that concluded in 2019 with no evidence of criminal wrongdoing.


    6. Key Events of the Campaign
    • 23 January 2013: Cameron’s Bloomberg speech commits a future Conservative majority government to renegotiation and an in/out referendum.
    • May 2015: Conservatives win a general election majority; the referendum pledge becomes a firm commitment.
    • 17-18 December 2015: EU leaders hold initial discussions on Cameron’s renegotiation demands at a European Council summit.
    • 18-19 February 2016: A renegotiation deal is agreed at a European Council summit in Brussels.
    • 20 February 2016: Cameron announces the referendum date of 23 June 2016 and frees Cabinet ministers to campaign on either side.
    • 13 April 2016: The Electoral Commission designates Vote Leave and Britain Stronger in Europe as the official lead campaigns.
    • 15 April 2016: The regulated referendum campaign period formally begins.
    • 16 June 2016: The Labour MP Jo Cox is murdered a week before polling day; campaigning is suspended for several days as a mark of respect.
    • 23 June 2016: The referendum is held; polls closed at 10pm.
    • 24 June 2016: The result is declared in the early hours; Leave has won, and Cameron announces he will resign as Prime Minister.
    • 13 July 2016: Theresa May becomes Prime Minister after a shortened Conservative leadership contest.

    7. The Result: What Happened and Why

    Leave won with 51.9% of the vote (17,410,742 votes) to Remain’s 48.1% (16,141,241 votes), a margin of 1,269,501 votes, on a turnout of 72.2%, higher than any UK general election since 1992.

    More people voted Leave than had ever voted for any party or candidate in UK electoral history to that point, giving the result a strong claim to a democratic mandate despite the closeness of the percentage margin.

    The result varied sharply across the UK. England and Wales recorded majorities for Leave, while Scotland and Northern Ireland recorded majorities for Remain, and within England London was the only region to vote Remain.

    NationLeaveRemainTurnout
    England53.4%46.6%73.0%
    Wales52.5%47.5%71.7%
    Scotland38.0%62.0%67.2%
    Northern Ireland44.2%55.8%62.7%

    Analysis of the results also showed strong correlations with age and education:

    • Younger voters and graduates were considerably more likely to have voted Remain
    • Older voters and those without a degree were considerably more likely to have voted Leave.
    • Geographically, large cities, university towns, Scotland, Northern Ireland and London tended towards Remain, while smaller towns, rural England, Wales and post-industrial areas tended towards Leave.

    8. The Aftermath: Short-Term and Long-Term Outcomes

    Short-term outcomes

    David Cameron formally left office on 13 July 2016.

    In the Conservative leadership contest that followed, Boris Johnson was initially the favourite but withdrew after Michael Gove announced his own candidacy; the contest was resolved when Andrea Leadsom withdrew, leaving Theresa May to become Prime Minister unopposed.

    The UK government notified the European Council of its intention to withdraw under Article 50 of the Treaty on European Union on 29 March 2017, after the Supreme Court’s ruling in the Miller case that Parliament’s authorisation was required first.

    May called a snap general election in June 2017 seeking a stronger negotiating mandate but lost her Commons majority and had to govern with the support of the Democratic Unionist Party.

    Prolonged parliamentary conflict followed during 2017 to 2019, with MPs rejecting May’s negotiated Withdrawal Agreement on three occasions; she resigned in July 2019 and was succeeded by Boris Johnson, who called a further general election in December 2019, fought substantially on the slogan ‘Get Brexit Done’, which the Conservatives won with an 80-seat majority.

    The Withdrawal Agreement was ratified, and the UK formally left the EU on 31 January 2020, with a transition period, during which existing arrangements continued, ending on 31 December 2020 alongside a new Trade and Cooperation Agreement.

    Long-term outcomes

    The referendum realigned party politics along Leave and Remain lines.

    These lines cut across the traditional left-right divide, contributing to the loss of previously safe Labour seats in Leave-voting areas, often termed the ‘Red Wall’, to the Conservatives in 2019, alongside gains for pro-Remain parties such as the Liberal Democrats and the SNP in strongly Remain-voting areas.

    The divergence between Scotland’s Remain vote and the UK-wide Leave result fed directly into the Scottish Government’s case for a further independence referendum, an attempt that was tested in the courts and rejected by the UK Supreme Court in November 2022, which ruled that the Scottish Parliament could not legislate for such a referendum without Westminster’s consent.

    The need to avoid a hard border between Northern Ireland and the Republic of Ireland produced further and continuing difficulty, addressed first through the Northern Ireland Protocol of 2019 and later through the Windsor Framework of 2023, both of which remained sources of political contention. Managing the practical UK-EU relationship, including periodic trade frictions and renegotiation of specific arrangements, has remained a recurring feature of UK politics for years after the vote itself.


    9. Conclusion: Was this the ‘Last’ UK Referendum?

    There is a reasonable case that the 2016 referendum may prove to have been the last UK-wide referendum for some time to come, and possibly the last of its kind altogether.

    Several features of the Brexit experience point in this direction.

    • The campaign exposed depths of division within both main parties and across the country that took years to work through in Parliament and at three subsequent general elections.
    • Both sides made claims, most notably the £350 million figure and some of the Treasury’s own economic forecasts, that were later disputed as misleading, damaging public trust in the process itself; the Electoral Commission also later found that Vote Leave had breached campaign spending rules.
    • The task of translating a single binary choice into a complex, multi-year negotiated outcome proved far harder than either campaign suggested during the vote, exposing a basic mismatch between the referendum as a device and the kind of question being asked of it.
    • The political cost was severe: three changes of Prime Minister within three years, and a decade of continued argument over the practical detail of withdrawal.

    In the years since 2016, no further UK-wide referendum has been held, and the Supreme Court’s 2022 ruling has, for now, closed off a further Scottish independence referendum without Westminster’s agreement.

    Taken together, this pattern suggests that governments of both main parties have preferred to resolve major constitutional questions since 2016 through general elections and ordinary parliamentary process rather than through further referendums, a marked change from the practice of the two decades before.

    This conclusion should, however, be treated as a reasoned judgement rather than a certainty.

    Demand for a further Scottish independence referendum has not disappeared, and a future shift in Scotland’s political arithmetic, or a significant change in the UK’s relationship with the EU, could yet revive the case for another UK-wide vote.

    Whether 2016 turns out to have been the last UK referendum, or simply the most recent in a sequence that resumes when political conditions allow, remains an open question for students of UK politics to weigh rather than one that can be answered definitively at this stage.


  • The Impact of Referendums on UK Political Life Since 1997


    1. Constitutional Practice and Parliamentary Sovereignty

    Legally, most UK referendums remain advisory: Parliament is not bound to implement a result and must still legislate to give it effect.

    In practice, however, results since 1997 have generally been treated as politically decisive, most strikingly in the case of the 2016 EU referendum, where a majority of MPs had personally favoured remaining in the EU but nonetheless voted to trigger withdrawal following the result.

    The frequency of referendums on major constitutional questions since 1997, covering devolution, the electoral system, Scottish independence and EU membership, has led some commentators to describe a new constitutional convention under which significant changes to the way the UK is governed are put to a public vote before Parliament legislates.


    2. Devolution and the Territorial Constitution

    The 1997 to 1998 referendums converted the UK from a highly centralised unitary state into one with substantial devolved government in Scotland, Wales, Northern Ireland and London.

    The 2011 Welsh referendum extended this by giving the Assembly full law-making powers in devolved areas.

    The rejection of an elected assembly for North East England in 2004 meant that devolution did not extend on the same model to the English regions, leaving an asymmetric settlement sometimes summarised as the West Lothian Question, addressed only partially and temporarily through the House of Commons’ English Votes for English Laws procedure between 2015 and 2021.

    The Belfast Agreement referendum also embedded the principle of consent directly into the Northern Ireland Act 1998: any future change to Northern Ireland’s constitutional status must itself be agreed through a referendum.


    3. The Union and Continuing Pressure for Further Referendums

    Although the 2014 referendum produced a no vote, it established the idea that Scotland’s continued membership of the Union rests on renewed popular consent.

    The 2016 Brexit result, in which Scotland voted to remain while the UK as a whole voted to leave, was used by the Scottish Government to argue that circumstances had changed materially enough to justify a further independence referendum.

    Attempts to hold a second referendum without the UK government’s agreement were tested in the courts, and in November 2022 the UK Supreme Court ruled, in a case referred by the Lord Advocate, that the Scottish Parliament cannot legislate for an independence referendum without Westminster’s consent. The question of a further Scottish referendum has remained a live and recurring issue in UK politics since 2014.


    4. Party Politics

    Divisions over Europe within the Conservative Party predate 1997 but were a central feature of the period covered here.

    The commitment to an EU referendum was made partly to manage internal party disagreement and to counter the electoral challenge posed by the UK Independence Party during the early 2010s.

    Instead, the referendum and its aftermath deepened Conservative divisions, contributing to three changes of prime minister between 2016 and 2019 (David Cameron, Theresa May and Boris Johnson) and to prolonged parliamentary conflict over the terms of withdrawal during 2017 to 2019.

    The Labour Party was similarly divided over how to respond to the result, and its position on a further referendum became a significant feature of the 2019 general election, which was fought substantially on the question of whether and how to implement the 2016 result.

    The referendum question was also linked to the emergence and electoral performance of UKIP before 2016 and the Brexit Party in the 2019 European Parliament elections.


    5. Regulation and Campaign Conduct

    The Political Parties, Elections and Referendums Act 2000’s framework of spending limits, designated lead campaigns and Electoral Commission oversight has applied to every UK-wide referendum since 2000.

    The conduct of the 2016 campaign nonetheless generated continuing scrutiny of the regulatory framework, including subsequent Electoral Commission findings against campaign groups on both sides in relation to spending returns, and wider debate about the adequacy of rules on referendum campaign finance and online campaigning.


    6. Turnout and Public Engagement

    Referendums on questions of national constitutional significance have at times produced markedly higher turnout than routine elections: 84.6% in the 2014 Scottish independence referendum and 72.2% in the 2016 EU referendum both exceeded turnout in the general elections held closest to them.

    Other referendums, including the 2011 AV referendum (42.2%) and most local mayoral and council tax referendums, have recorded much lower turnout, suggesting that public engagement with the referendum device has varied considerably according to the perceived significance of the question being asked.


    7. Referendums as a Recurring Constitutional Tool

    Taken together, the referendums held since 1997 mark a clear shift in UK political practice.

    Where referendums had been used only once at UK level before 1997, at least eight referendums of national or UK-wide significance were held between 1997 and 2016, alongside a growing number of local referendums on mayoral governance and council tax, placed on a statutory footing by the Localism Act 2011. The referendum, once an exceptional device, became a regular part of how major changes to the UK’s constitutional arrangements were decided.


    8. Conclusion

    Since 1997, referendums have moved from being a rare and exceptional device in UK politics to a recurring instrument used to authorise devolution, to settle questions about the electoral system, and to decide the country’s constitutional future within the Union and its relationship with the European Union.

    Their cumulative effect has been to reshape the UK’s territorial constitution, to realign party politics around the issues they raised, and to leave open questions, particularly over Scotland’s constitutional future and the balance of devolved power across the UK, that continue to shape political debate.


  • Referendums in the UK Since 1997: How They Have Been Used

    1. Introduction: Referendums and the UK Constitution

    A referendum is a direct vote in which the whole electorate, or the electorate of a particular nation or region, is asked to decide a single question, usually by choosing between two options.

    The UK constitution is uncodified and rests on the doctrine of parliamentary sovereignty, meaning that legally Parliament remains free to legislate as it wishes and referendum results are not, in themselves, legally binding on Parliament unless a specific Act says otherwise.

    In practice, however, referendum results on major constitutional questions have generally been treated by governments as politically decisive.

    Before 1997, referendums played almost no part in UK politics. There was one UK-wide referendum, held in 1975 on continued membership of the European Economic Community, and two devolution referendums in 1979 on proposed assemblies for Scotland and Wales (the Scottish result narrowly failed to clear a required threshold and the Welsh proposal was rejected outright).

    From 1997 onwards, referendums became a recurring feature of UK political life, used first to authorise the devolution settlements created by the incoming Labour government, and later to decide questions of electoral reform, Scottish independence and continued EU membership.


    2. Chronology of Major Referendums Since 1997

    The devolution referendums, 1997 to 1998

    Tony Blair’s Labour government elected in May 1997 had committed to a programme of constitutional reform, including devolved government for Scotland, Wales, Northern Ireland and London. Referendums were used to authorise each of these changes before the relevant legislation was passed.

    • Scotland, 11 September 1997: two questions were asked, on whether there should be a Scottish Parliament and whether it should have tax-varying powers. Both were carried, with 74.3% and 63.5% voting yes respectively, on a turnout of 60.4%.
    • Wales, 18 September 1997: voters were asked whether there should be a National Assembly for Wales. The result was a narrow yes, 50.3% to 49.7%, on a turnout of 50.1%.
    • London, 7 May 1998: a referendum on creating a Greater London Authority and a directly elected Mayor of London returned a 72.0% yes vote, on a turnout of 34.1%.
    • Northern Ireland, 22 May 1998: voters were asked whether they endorsed the Belfast, or Good Friday, Agreement, which established the Northern Ireland Assembly and a power-sharing executive. The result was 71.1% in favour, on a turnout of 81.1%, the highest of any of the 1997 to 1998 referendums.

    The Scotland Act 1998, Government of Wales Act 1998, Northern Ireland Act 1998 and Greater London Authority Act 1999 subsequently gave legal effect to these results.

    A statutory framework: the Political Parties, Elections and Referendums Act 2000

    The Political Parties, Elections and Referendums Act 2000 (PPERA) created a statutory framework that has applied to referendums held since then.

    It introduced spending limits for campaigners, provision for one lead campaign organisation to be designated on each side of a question, and oversight of referendum conduct and finance by the newly created Electoral Commission.

    Further devolution and regional referendums, 2004 to 2012

    • North East England, 4 November 2004: voters rejected a proposed elected regional assembly by 77.9% to 22.1%, on a turnout of 47.7%. This result ended the wider Labour government plan to extend elected regional government across England.
    • Local mayoral and council tax referendums: under the Local Government Act 2000 and later the Localism Act 2011, a number of English local authorities have held referendums on whether to adopt a directly elected mayor, with mixed results, and the Localism Act 2011 also introduced a requirement for a local referendum before a council can implement a council tax increase above a threshold set annually by central government.
    • Wales, 3 March 2011: voters were asked whether the National Assembly for Wales should gain full primary law-making powers in its devolved areas without needing separate Westminster approval for each measure. The result was 63.5% yes, on a turnout of 35.4%.

    The Alternative Vote referendum, 5 May 2011

    Under the terms of the 2010 Conservative-Liberal Democrat Coalition Agreement, a UK-wide referendum was held on whether to replace First Past the Post with the Alternative Vote for electing MPs to the House of Commons.

    The proposal was rejected by 67.9% to 32.1%, on a turnout of 42.2%.

    The Scottish independence referendum, 18 September 2014

    Following the Scottish National Party’s majority in the 2011 Scottish Parliament election, the UK and Scottish governments concluded the Edinburgh Agreement in 2012, and the Scottish Independence Referendum Act 2013 authorised a referendum on the question, ‘Should Scotland be an independent country?’

    The result was 55.3% no to 44.7% yes, on a turnout of 84.6%, the highest recorded in any UK-wide or national referendum or election since the introduction of near-universal suffrage.

    In the closing days of the campaign, the leaders of the three main Westminster parties jointly pledged further devolved powers for Scotland in the event of a no vote, a commitment that fed into the Scotland Act 2016.

    The European Union membership referendum, 23 June 2016

    A referendum on the UK’s membership of the European Union had been promised by David Cameron in a 2013 speech and repeated in the Conservative Party’s 2015 general election manifesto.

    It was authorised by the European Union Referendum Act 2015. The question asked whether the UK should remain a member of or leave the EU.

    Leave won with 51.9% of the vote to Remain’s 48.1%, on a turnout of 72.2%.

    The result varied markedly by nation: England and Wales recorded majorities for Leave, while Scotland and Northern Ireland recorded majorities for Remain.

    David Cameron resigned as Prime Minister the day after the result, and the UK formally left the EU on 31 January 2020, with the post-exit transition period ending on 31 December 2020.


    3. Summary of Major UK Referendums Since 1997
    DateReferendumResultTurnout
    11 Sept 1997Scotland: Scottish Parliament and tax-varying powersYes 74.3% / Yes 63.5%60.4%
    18 Sept 1997Wales: National Assembly for WalesYes 50.3%50.1%
    7 May 1998London: Mayor and Greater London AuthorityYes 72.0%34.1%
    22 May 1998Northern Ireland: Belfast (Good Friday) AgreementYes 71.1%81.1%
    4 Nov 2004North East England: elected regional assemblyNo 77.9%47.7%
    3 March 2011Wales: full law-making powers for the AssemblyYes 63.5%35.4%
    5 May 2011UK-wide: Alternative Vote for general electionsNo 67.9%42.2%
    18 Sept 2014Scotland: independence from the United KingdomNo 55.3%84.6%
    23 June 2016UK-wide: membership of the European UnionLeave 51.9%72.2%

    Figures are the official results published by the returning authorities and the Electoral Commission; minor discrepancies of a fraction of a percentage point appear in some published sources owing to rounding and rejected ballots.


  • The UK Electoral System:

    1. Introduction and Key Terminology

    An electoral system is the mechanism by which votes cast in an election are converted into seats in a legislature, or into a single office such as a mayoralty. The choice of system is not neutral: it shapes which parties can realistically win power, how governments are formed, how voters behave, and how closely the outcome reflects the wishes of the electorate. The United Kingdom does not use a single electoral system; different systems operate concurrently for Westminster, the devolved parliaments, London, and local government.

    Three families of system

     Plurality systems award victory to whoever wins the most votes, even well short of 50 per cent. The UK’s First Past the Post (FPTP) system is, strictly, a plurality system, though textbooks conventionally group it with majoritarian systems because both manufacture a decisive winner rather than mirror the electorate.

    • Majoritarian systems require an absolute majority (50 per cent plus one) to win, usually via a second round of voting or a preferential ballot with elimination rounds. The UK does not currently use a true majoritarian system for any major election, though the Alternative Vote (AV) was rejected by 67.9 per cent to 32.1 per cent in a 2011 referendum.
    • Proportional representation (PR) systems aim to allocate seats to parties in close proportion to their vote share. There is no single PR system: the family includes Closed List PR, the Single Transferable Vote (STV), and hybrid systems such as the Additional Member System (AMS), internationally known as Mixed Member Proportional (MMP).

    2. First Past the Post (FPTP)

     Mechanics

    • The country is divided into 650 single-member constituencies for Westminster (the same principle applies to most English local council wards).
    • Voters mark a single cross against one candidate.
    • The candidate with the most votes wins, regardless of whether they reach 50 per cent.
    • The party with the most seats overall usually forms the government, alone or, if no party reaches a majority, through coalition (2010) or confidence-and-supply arrangements (2017).

     Where it is used

    • UK general elections, electing MPs to the House of Commons.
    • English local council elections.
    • Directly elected mayors in England, including the Mayor of London, which reverted to FPTP from the Supplementary Vote under the Elections Act 2022.

     Strengths

    • Simplicity: a single cross for voters, and fast counting for officials.
    • A strong constituency link, since every elector has one identifiable, accountable MP or councillor.
    • Tends to produce decisive, single-party majority government.
    • Raises the effective threshold against small or extreme parties, since winning a seat requires concentrated local support.

     Weaknesses

    • High disproportionality between a party’s vote share and its seat share.
    • Wasted votes: ballots cast for losing candidates, or surplus votes above the winning margin, have no effect on the result.
    • Safe seats: many constituencies do not change hands for decades, which critics argue depresses turnout and campaign effort.
    • Tactical voting: electors often back their preferred candidate’s strongest rival rather than expressing a sincere first preference.
    • Rewards geographically concentrated support (for example the SNP, or Liberal Democrat target seats) and punishes support that is spread evenly across the country (Reform UK, the Green Party).
    • Duverger’s Law: plurality systems tend to compress competition into two dominant parties, though the 2024 result has renewed debate about whether this pattern is weakening in the UK.

     Evidence: the 2024 general election

    PartyVote shareSeats wonSeat share
    Labour33.7%41163.2%
    Conservative23.7%12118.6%
    Reform UK14.3%50.8%
    Liberal Democrat12.2%7211.1%
    Green6.7%40.6%
    SNP2.5% (UK-wide)91.4%
    • Labour won a majority of 174 seats on barely a third of the national vote, widely described as the most disproportionate result on record.
    • Reform UK won almost 4.1 million votes, more than several other parties combined, but only five seats, because its support was spread evenly rather than concentrated.
    • An estimated 58 per cent of votes cast in 2024 did not contribute to the result (were “wasted”).

     3. The Additional Member System (AMS)

     Mechanics

    • A hybrid of FPTP and PR. Voters cast two votes: a constituency vote (decided by FPTP) and a regional list vote.
    • Regional list seats are allocated using the D’Hondt formula, which compensates parties under-represented by the constituency results relative to their regional vote share.

     Where it is used

    • The Scottish Parliament (Holyrood).
    • The London Assembly.
    • Wales used AMS for the Senedd from 1999 to 2021, before moving to Closed List PR (see Section 5).

     Strengths

    • Combines a local constituency representative with overall proportionality.
    • Allows split-ticket voting: a local candidate from one party, a regional vote for another.
    • Reduces wasted votes relative to FPTP.
    • Encourages consensus politics rather than single-party dominance.

     Weaknesses

    • Creates two tiers of representative: constituency members with a local mandate, and list members without one.
    • Party leaderships control list ordering, giving them significant influence over who is elected.
    • Parties can attempt to “game” the regional calculation through separate list vehicles.
    • The D’Hondt calculation is less transparent to voters than simple plurality counting.

     Evidence: Scotland 2026 (actual AMS result)

    PartyAMS seats (of 129)Constituency vote share
    SNP5838.2%
    Reform UK1715.8%
    Scottish Labour1719.2%
    Scottish Greens15~2.3%
    Scottish Conservatives12~12.0%
    Scottish Liberal Democrats10~10.0%
    • The SNP remained the largest party but fell seven seats short of a majority (65 needed), requiring First Minister John Swinney to lead a minority administration.
    • Six parties won representation, illustrating AMS’s semi-proportional character.

     4. Single Transferable Vote (STV)

     Mechanics

    • Used in multi-member constituencies, typically returning three to six representatives.
    • Voters rank candidates in order of preference (1, 2, 3, and so on).
    • Candidates must reach the Droop Quota to be elected: Quota = (Total valid votes ÷ (Seats available + 1)) + 1.
    • Candidates exceeding the quota on first preferences are elected, and their surplus votes are transferred according to next preferences. If no candidate meets the quota, the lowest-placed candidate is eliminated and their votes redistributed. The process repeats until all seats are filled.

     Where it is used

    • The Northern Ireland Assembly.
    • Local government elections in Scotland and Northern Ireland.
    • Comparative note: used nationally in the Republic of Ireland.

     Strengths

    • Maximum voter choice: electors can rank candidates within or across parties, or support independents.
    • High proportionality without handing party leaderships control over list order.
    • Eliminates safe seats, since candidates from the same party must compete against one another for preferences.
    • Encourages candidates to seek transfers from outside their core base, promoting cross-community moderation, notably in Northern Ireland.

     Weaknesses

    • A complex counting process involving multiple rounds of quota calculation and transfer, which can take days to resolve.
    • A diluted local link, since multi-member constituencies are geographically larger and shared between several representatives.
    • Intra-party rivalry, as party colleagues compete against one another for first preferences.
    • Can produce fragmented assemblies requiring protracted coalition negotiation.

     Evidence: Northern Ireland Assembly, May 2022

    • 90 MLAs were elected across 18 multi-member constituencies (5 seats each).
    • Sinn Féin became the largest party with 27 seats on 29.0 per cent of first-preference votes.
    • The cross-community Alliance Party rose to 17 seats from just 13.5 per cent of first preferences, by attracting transfers from both nationalist and unionist voters, illustrating STV’s capacity to reward consensus-building.

     5. Closed Proportional List

     Mechanics

    • Multi-member regions elect several representatives.
    • Parties publish a pre-ordered list of candidates before polling day.
    • Electors vote for a party, not an individual candidate.
    • Seats are allocated to parties in proportion to regional vote share (again, typically the D’Hondt formula), and filled strictly in the order set by the party.

     Where it is used

    • Senedd Cymru (the Welsh Parliament), following the Senedd Cymru (Members and Elections) Act 2024.
    • Historically, UK elections to the European Parliament, until Brexit.

     Strengths

    • Near-exact proportionality between vote share and seat share.
    • Very simple for voters: a single choice of party.
    • Fair to smaller parties that cross the regional threshold.
    • Allows parties to structure lists for demographic balance, such as gender.

     Weaknesses

    • Severs the link between a representative and a specific local area.
    • Places candidate selection entirely in the hands of party leaderships.
    • No ability for voters to choose between individual candidates within a party.
    • Small parties can gain disproportionate leverage in coalition bargaining.

     Evidence: Senedd Cymru, May 2026

    • The Senedd was enlarged to 96 members, elected across 16 six-member constituencies.
    • Plaid Cymru became the largest party for the first time since devolution began, with 43 seats on 35.4 per cent of the vote.
    • Reform UK entered the Senedd for the first time, becoming the second-largest party with 34 seats on 29.3 per cent.
    • Welsh Labour fell to third place with 9 seats, the first Senedd election in which Labour has not been the largest party.
    • The Electoral Reform Society’s Loosemore-Hanby disproportionality score for the result was 15.5, against 47.4 for the equivalent 2024 Westminster result in Wales, a useful concrete figure for showing that PR narrows the gap between votes and seats.

     6. The UK’s Mixed Electoral Landscape
    InstitutionSystem used
    UK Parliament (Westminster)FPTP
    Scottish ParliamentAMS
    Senedd Cymru (Welsh Parliament)Closed List PR since 2026 (AMS 1999-2021)
    Northern Ireland AssemblySTV
    London AssemblyAMS
    London Mayor, other English mayors, PCCsFPTP (reverted from Supplementary Vote, 2022)
    Local councils, EnglandFPTP
    Local councils, Scotland and Northern IrelandSTV

    This patchwork allows a natural experiment: broadly the same electorate and party system produce different outcomes depending on the electoral rule applied, which is useful evidence for evaluation essays.


     7. Counterfactual Case Studies: What if the System Had Been Different?

     Scotland 2026: AMS versus a hypothetical FPTP

    • Under the actual AMS result, six parties won seats and the SNP formed a minority government, seven seats short of a majority.
    • Modelling the same constituency-level votes under FPTP (73 single-member seats) would have given the SNP 57 seats (78.1 per cent) from just 38.2 per cent of the constituency vote, an outright majority.
    • Reform UK (15.8 per cent of the vote) would have won 0 constituency seats under FPTP, against the 17 seats it actually won via the regional list.
    • Scottish Labour (19.2 per cent) would have fallen to 2 seats under FPTP, rather than the 17 it actually won.
    • Judgement: AMS produced the more representative outcome, since it aligned seats more closely with vote share and avoided a large “manufactured majority” for the SNP.

     Wales 2026: Closed List versus a hypothetical FPTP

    • Under the actual Closed List result, Welsh Labour won 41 of 96 seats, 8 short of a majority, requiring cross-party cooperation.
    • Modelling the same voting patterns under FPTP (96 single-member seats) would have given Welsh Labour an estimated 68 seats (70.8 per cent) from around 35 per cent of the vote.
    • Reform UK (an estimated 16 per cent of the vote) would have won just 1 seat under FPTP, against the 14 it actually won under the Closed List.
    • Judgement: as in Scotland, the proportional system produced the outcome more closely aligned with actual public support, at the cost of requiring coalition or cross-party negotiation to govern.

     The 2024 general election, modelled under PR

    A note on methodology: this is informed estimation, not genuine alternative history. Under a different system, parties would field different candidates, campaigns would differ, and voters freed from the incentive to vote tactically (around a third of 2024 voters said they had) might have voted differently in the first place. The figures below come from the Electoral Reform Society, “A System Out of Step: The 2024 General Election” (December 2024). The ERS is a campaigning organisation for electoral reform, so its figures are worth reading with that advocacy position in mind; its modelling used a YouGov poll of voters’ preference rankings, rather than simply reallocating raw FPTP votes.

    PartyActual (FPTP)STVAMS (50:50)AMS (68:32)List PR
    Labour411227228282194
    Conservative121148139134147
    Liberal Democrats7271735878
    Reform UK59010075109
    Green Party467715783
    SNP916161816
    Plaid Cymru48455
    • Labour’s majority disappears under every modelled variant. Even the least proportional model tested, AMS (68:32), gives Labour only 282 seats, short of the 326 needed.
    • Reform UK’s seat total rises to somewhere between 75 and 109, broadly proportionate to its 14.3 per cent vote share, compared with 5 actual seats.
    • A genuinely multi-party Commons emerges in every scenario; the ERS suggests the likeliest outcome would be a Labour-led coalition with the Liberal Democrats and/or the Greens, against a divided right of Conservatives and Reform UK.
    • The specific proportional system chosen still matters: moving from AMS (50:50) to AMS (68:32) alone shifts around 54 seats towards Labour, a reminder that “PR” is a spectrum rather than a single outcome.

     8. The FPTP versus PR Debate: Who Argues What, and Why

     Political parties

    • Conservative Party: the strongest institutional defender of FPTP, emphasising stable single-party government and the constituency link. Critics note the Conservatives have directly benefited from FPTP’s disproportionality, for example 43.6 per cent of the vote producing a comfortable majority in 2019.
    • Labour Party: historically ambivalent, having benefited from FPTP landslides in 1997, 2001 and 2024, though a significant and growing faction, including affiliated trade unions, has passed conference motions favouring PR.
    • Liberal Democrats: the most consistent advocates of reform, specifically STV, on grounds of fairness. In 2015, the Liberal Democrats and UKIP together won around a quarter of the vote but a tiny fraction of seats.
    • Smaller and regional parties (the Green Party, Reform UK, Plaid Cymru): strong advocates of PR, since their support is dispersed rather than concentrated. The SNP is a partial exception: FPTP has worked in its favour in Scotland (56 of 59 Scottish seats on 50 per cent of the Scottish vote in 2015), so its enthusiasm for reform is more selective, and tends to focus on Scottish independence.

     Pressure and interest groups

    • Make Votes Matter and the Electoral Reform Society campaign for a proportional Westminster system, arguing FPTP produces unrepresentative governments, encourages tactical voting, and creates safe seats where turnout and engagement fall. The Electoral Reform Society has campaigned for reform since 1884.
    • Fairer Vote and Unlock Democracy connect electoral reform to wider concerns about political disengagement, especially among younger voters, arguing a vote in a safe seat can feel meaningless.
    • Defenders of FPTP, including some constitutional think tanks, argue that its simplicity and clear accountability outweigh its disproportionality, pointing to coalition or minority government in more proportional systems such as Germany or Israel as evidence that PR can produce weak or unstable government.

     The press

    • Right-leaning outlets (the Daily Mail, The Telegraph, The Sun) generally defend FPTP, echoing arguments about stability and the constituency link, and often frame PR as risking “coalition chaos”.
    • Left-leaning and centrist outlets (The Guardian, The Independent, The Mirror) are more sympathetic to reform, with The Guardian giving particular attention to disproportionality and wasted votes, especially after skewed results such as 2015 and 2024.
    • Broadcasters (the BBC, Sky News, ITV) are bound by Ofcom impartiality rules and present both sides of the debate more evenly, particularly around election results and referendum moments such as the 2011 AV referendum.

    Key evaluative point for essays

    • Positions in this debate are rarely held on principle alone. Parties and pressure groups tend to support whichever system best serves their own electoral prospects, which is a valuable point for interrogating stated motives rather than taking them at face value.

     9. A Comparative Case: The United States
    • The House of Representatives is elected via single-member plurality districts, functionally similar to FPTP, producing a two-party system arguably even more rigidly entrenched than the UK’s, since minor parties almost never win federal seats.
    • Gerrymandering, the deliberate manipulation of district boundaries by state legislatures to advantage one party, is a distinctly American aggravation of the disproportionality inherent in plurality systems.
    • The Senate is not proportional to population at all: every state elects two senators regardless of size, so California (around 39 million people) has the same representation as Wyoming (around 580,000). This is a deliberate federal design feature rather than a proportionality failure.
    • The Electoral College, which formally elects the President, is a largely winner-takes-all, state-based system: in 48 of 50 states, all of that state’s electoral votes go to whoever wins its popular vote, however narrow the margin. This has twice produced a president who lost the national popular vote, George W. Bush in 2000 and Donald Trump in 2016, arguably a more extreme distortion than anything produced by UK FPTP, since it can invert the national result entirely.
    • Comparing the UK and US cases shows that plurality logic produces broadly similar effects (two-party dominance, safe versus competitive seats, disproportionality) wherever it is applied, but the severity depends on surrounding institutional design, such as how district boundaries are drawn and controlled, and whether the system sits within a federal structure.

     10. Evaluation Framework
    CriterionFPTP / majoritarian systemsPR systems
    Proportionality of votes to seatsWeak; can produce landslide majorities from a minority of the voteStrong, varies by type (list PR strongest, AMS semi-proportional)
    Government stability and decisivenessUsually strong; single-party majorities more likelyWeaker; coalition or minority government more common
    Voter choiceLimited to one cross; little intra-party choiceGreater under STV and open list; limited under closed list
    Simplicity for votersVery simpleVaries; STV and list systems more complex than FPTP
    Constituency accountabilityStrong; single named MPVaries; strong under STV/AMS, weak under closed national list
    Representation of smaller partiesPoorGood, subject to any threshold
    Risk of extremist representationLow (high effective threshold from local plurality)Higher without a formal vote threshold
    Government mandate clarityHigh: governing party’s manifesto usually enactableLower: coalition agreements often dilute manifesto commitments

    No system performs well against every criterion simultaneously. This trade-off, rather than a single “correct” answer, is the central analytical point that examiners reward in evaluation.


     11. Conclusion
    • The underlying tension is between decisiveness and accountability on one side, and fairness and representativeness on the other.
    • FPTP delivers simple, usually stable, single-party government with clear accountability, at the cost of significant, sometimes extreme, distortion between votes and seats, as the 2024 general election illustrates starkly.
    • PR systems correct that distortion and better reflect a pluralistic, multi-party society, but generally produce coalition or minority government and, in some variants, dilute the direct constituency link.
    • The UK’s own experience, running FPTP at Westminster alongside AMS in Scotland, Closed List PR in Wales, and STV in Northern Ireland, offers a built-in comparison for exam answers, while the American case shows how majoritarian logic can produce even sharper distortions when layered onto a federal structure.
    • There is no electoral system that is neutral among these values: the choice of system is, in effect, a choice about which democratic values a political system prioritises.
  • The FPTP vs PR Debate


    Political Parties

    Conservative Party The Conservatives are the strongest defenders of First Past the Post. Their argument centres on the strong, stable single-party government FPTP tends to produce, avoiding the “backroom deals” and coalition horse-trading associated with PR systems.

    They also stress the constituency link, arguing that FPTP gives voters a clear, identifiable local MP who is directly accountable to them.

    Critics note that the Conservatives have often been direct beneficiaries of FPTP’s disproportionality (for example, the 2019 landslide on around 43.6% of the vote), which gives them a strong institutional incentive to defend the status quo.

    Labour Party Labour’s position has historically been more ambivalent. The party has also benefited from FPTP landslides (1997, 2001, 2024), so many within the leadership are reluctant to abandon a system that can deliver commanding majorities from a minority of the vote.

    However, a significant and growing faction within Labour, including affiliated trade unions and constituency parties, has passed conference motions in favour of PR, arguing it would better reflect progressive values and prevent future Conservative governments winning large majorities on a minority of the vote.

    Liberal Democrats The Liberal Democrats are the most consistent and vocal supporters of electoral reform, specifically the Single Transferable Vote (STV).

    Their argument is rooted in fairness: FPTP has repeatedly punished them, with their vote share translating into a much smaller share of seats (a clear case study is 2015, where UKIP and the Lib Dems together won around a quarter of the vote but a tiny fraction of seats).

    They argue PR would end “wasted votes” and better represent the diversity of political opinion in the country.

    Smaller and Regional Parties (Green Party, Reform UK, SNP, Plaid Cymru) Smaller parties with dispersed support, such as the Greens and Reform UK, are strong advocates for PR because FPTP structurally disadvantages parties whose vote is spread thinly across the country rather than concentrated in winnable seats.

    The SNP presents an interesting case: because their support is geographically concentrated in Scotland, FPTP has actually worked in their favour at Westminster (e.g. 2015, winning 56 of 59 Scottish seats on 50% of the Scottish vote), so their enthusiasm for reform is more selective and tends to focus on Scottish independence rather than the voting system itself.

    Pressure and Interest Groups

    Make Votes Matter / Electoral Reform Society These are the leading pressure groups campaigning for PR in the UK.

    Make Votes Matter campaigns specifically for a proportional system for Westminster elections, arguing that FPTP produces “unrepresentative” governments, encourages tactical voting, creates large numbers of “safe seats” where turnout and engagement fall, and locks smaller parties out of Parliament despite significant public support.

    The Electoral Reform Society has campaigned for reform since 1884 and produces detailed analysis after every general election showing the gap between vote share and seat share.

    Fairer Vote / Unlock Democracy These groups make a broader democratic case, arguing that FPTP contributes to political disengagement, particularly among younger voters, because a vote in a safe seat can feel meaningless.

    They link electoral reform to wider constitutional questions about trust in politics and representation.

    Defenders of FPTP (e.g. some constitutional think tanks) Some groups, alongside sections of the Conservative Party, argue that the simplicity and clear accountability of FPTP outweighs its disproportionality.

    They point to the coalition and confidence-and-supply arrangements produced in more proportional systems elsewhere (such as Germany or Israel) as evidence that PR can lead to weak, unstable, or gridlocked government, and that voters often struggle to identify who is actually “in charge” after an election under PR.

    The Press

    Right-leaning press (Daily Mail, The Telegraph, The Sun) These outlets have generally defended FPTP, echoing Conservative arguments about stability, strong government and the constituency link.

    They have often been sceptical of PR, framing it as a system that would hand disproportionate power to smaller, sometimes extreme, parties and lead to “coalition chaos” akin to some continental European examples.

    Left-leaning and centrist press (The Guardian, The Independent, The Mirror) These outlets have been more sympathetic to reform, particularly The Guardian, which has run extensive coverage and comment pieces on the disproportionality of FPTP results, the number of “wasted votes”, and the case for PR strengthening democratic legitimacy.

    Coverage tends to intensify after elections with particularly skewed results (2015 and 2024 are commonly cited).

    Broadcast media (BBC, Sky News, ITV) Broadcasters are bound by Ofcom’s impartiality rules, so their coverage of the FPTP/PR debate tends to be more balanced, typically presenting the arguments of both reform campaigners and defenders of the status quo, often around general election results and referendum moments (such as the 2011 AV referendum).

    Key Point for Essays

    When answering questions on this debate, it is worth noting that positions are rarely principled alone.

    They are heavily shaped by self-interest: parties and groups tend to support the system that best serves their own electoral prospects.

    This is a useful evaluative point for A-level answers, since it allows you to interrogate the motives behind each stakeholder’s stated position rather than taking their arguments at face value.


  • What if . . . the 2024 General Election had been held using Proportional Representation?


    You need to be careful with the methodology: voters, parties and campaigns behave differently depending on the electoral system in place, so re-running FPTP vote totals through a different seat-allocation formula doesn’t necessarily reproduce what would actually have happened.

    Under PR, more parties would likely stand candidates, campaigns would shift, and voters freed from the incentive to vote tactically (about a third of 2024 voters said they had) might have voted differently in the first place. This is an informed estimate, not a genuine alternative history.

    The source: these projections come from the Electoral Reform Society (ERS), a campaigning organisation for electoral reform, so its figures are worth reading with that advocacy position in mind.

    Its methodology goes beyond simply reallocating raw FPTP votes: it commissioned a YouGov poll asking voters how they would have ranked parties in order of preference, and used those preference patterns, by region, to model transfers and list allocations. Northern Ireland’s own party results weren’t separately modelled, so its 18 seats are held constant throughout.

    Source: A System Out of Step: The 2024 General Election (ERS, December 2024) — https://electoral-reform.org.uk/latest-news-and-research/publications/a-system-out-of-step-the-2024-general-election/

    PartyActual (FPTP)STVAMS (50:50)AMS (68:32)List PR
    Labour411227228282194
    Conservative121148139134147
    Liberal Democrats7271735878
    Reform UK59010075109
    Green Party467715783
    SNP916161816
    Plaid Cymru48455
    Independents55020
    Northern Ireland parties*1818181818
    The Speaker**10110

    *Held constant at the actual total. **Modelled only under AMS, given the uncontested nature of the seat.

    Labour’s majority disappears under every variant. Even AMS (68:32), the least proportional model tested, gives Labour only 282 seats, short of the 326 needed. Under STV it falls to 227. Labour stays comfortably the largest party throughout, but would need at least one coalition partner, and in most scenarios two.

    Reform UK’s fortunes are transformed, rising from 5 seats to somewhere between 75 and 109, roughly proportionate to its 14.3% vote share. The Green Party sees the same pattern less dramatically, rising from 4 to between 57 and 83.

    A genuinely multi-party Commons emerges in every scenario, with the ERS suggesting the likeliest outcome across all three systems would be a Labour-led coalition with the Liberal Democrats and/or Greens, against a right split between the Conservatives and Reform UK.

    The specific system chosen still matters. Moving from AMS (50:50) to AMS (68:32) alone shifts around 54 seats towards Labour — a reminder that “PR” is a spectrum, not one outcome.


  • Plurality/Majoritarian or Proportional Representation?


    Electoral Systems: Plurality/Majoritarian versus Proportional Representation

    1. Introduction and key terminology

    An electoral system is the mechanism by which votes cast in an election are converted into seats (or, in some cases, a single office). The choice of system is not a neutral technical matter: it shapes which parties can realistically win power, how governments are formed, how voters behave, and how fairly the outcome reflects the wishes of the electorate. This is one of the most heavily contested areas of UK Politics, and it rewards precise use of terminology, so it is worth clarifying some distinctions before going further.

    Plurality systems award victory to whichever candidate or party gets the most votes, even if that is well short of 50%. The UK’s First Past the Post (FPTP) system is a plurality system, not strictly a majoritarian one, although it is conventionally grouped with majoritarian systems in most textbooks because both families share a common effect: they tend to manufacture a clear winner rather than mirror the electorate proportionally.

    Majoritarian systems require a candidate to secure an absolute majority (50%+1) of votes to win, which usually involves either a second round of voting (the two-round system used in French presidential elections) or a preferential ballot with elimination rounds (the Alternative Vote, AV). The UK does not currently use a true majoritarian system for any major election, though AV was put to a national referendum in 2011.

    Proportional representation (PR) systems aim to allocate seats to parties in close proportion to their share of the vote. There is no single PR system; the family includes list PR, the Single Transferable Vote (STV), and hybrid/mixed systems such as the Additional Member System (AMS), also known internationally as Mixed Member Proportional (MMP).

    This analysis treats “pluralistic/majoritarian” systems together, since that is how they are usually discussed in comparative terms (as systems that prioritise decisive outcomes over proportionality), while noting where the plurality/majoritarian distinction actually matters.


    2. Plurality and majoritarian systems

    First Past the Post (FPTP): mechanics

    FPTP is used for UK general elections (electing MPs to the House of Commons) and for most English and Welsh local council elections. The mechanics are simple:

    • The country is divided into 650 single-member constituencies.
    • Voters mark a single “X” against one candidate.
    • The candidate with the most votes in each constituency wins, regardless of whether they secured 50% of the vote.
    • The party that wins the most seats overall (not necessarily the most votes) typically forms the government, either alone with a majority or, if no party reaches 326 seats, through coalition or confidence-and-supply arrangements (as with the Conservative-Lib Dem coalition of 2010, or the Conservative-DUP confidence-and-supply deal of 2017).

    Effects of FPTP

    Disproportionality between votes and seats. This is the most consistent and heavily criticised feature of FPTP. The 2024 general election is a stark recent illustration:

    PartyVote shareSeats wonSeat share
    Labour33.7%41163.2%
    Conservative23.7%12118.6%
    Reform UK14.3%50.8%
    Liberal Democrat12.2%7211.1%
    Green6.7%40.6%
    SNP2.5% (UK-wide)91.4%

    Labour won a landslide majority of 174 seats on barely a third of the national vote, while Reform UK, with almost 4.1 million votes (more than the SNP, Greens and several other parties combined), won only five seats. The House of Commons Library and other analysts described this as the most disproportionate result on record, illustrating how FPTP can produce a “landslide from a minority” and simultaneously exclude a party with substantial but geographically dispersed support.

    Manufactured majorities. FPTP tends to reward the largest party with a bonus in seats beyond its vote share, because winning narrowly in many constituencies accumulates seats efficiently, while coming a close second everywhere yields nothing. This is precisely what benefited Labour in 2024 and, in reverse, previously helped the Conservatives secure comfortable majorities on vote shares in the low-to-mid 40s (as in 2019, when 43.6% of the vote produced 56.2% of seats).

    Two-party dominance (Duverger’s Law). The political scientist Maurice Duverger observed that plurality systems tend to squeeze the party system down to two dominant parties, because voters and donors gravitate towards whichever of the two front-runners is more likely to defeat the party they dislike most, rather than “wasting” support on a third option. This has historically held in the UK, with Labour and the Conservatives dominating government since 1935, although the 2024 result (with Reform, the Greens and the Liberal Democrats all achieving significant vote shares) has renewed debate about whether this pattern is weakening.

    Wasted votes and safe seats. Votes cast for a losing candidate, and votes cast above the winning margin for the successful candidate, are often described as “wasted” because they do not affect the outcome. Many UK constituencies are “safe seats” that have not changed hands for decades, which critics argue depresses turnout and reduces the incentive for parties to campaign nationally, concentrating effort instead on a shrinking number of marginal seats.

    Tactical voting. Because votes for smaller parties can appear futile in a given constituency, voters often vote tactically for their preferred candidate among the two most likely winners, rather than expressing a sincere first preference. This distorts the apparent level of support for smaller parties and makes the system harder to interpret as a clear expression of public opinion.

    Geographic concentration versus dispersal. FPTP rewards parties whose support is geographically concentrated (the SNP in Scotland, the Liberal Democrats in their target seats after refining their 2024 strategy) and punishes parties whose support is spread evenly across the country (Reform UK and the Greens in 2024).

    Strong, stable, accountable government. The case in favour of FPTP rests heavily on the government it tends to produce. A single party with a working majority can govern without needing to negotiate its programme with coalition partners, and voters know clearly who to reward or blame at the next election. This is often summarised as the trade-off between proportionality and governability: FPTP sacrifices the former for the latter, at least in normal circumstances (though the hung parliaments of 2010 and 2017 show it does not always deliver single-party majorities).

    Strong constituency link. Each MP represents a single, identifiable geographic constituency, which supporters of FPTP argue strengthens accountability and gives constituents a clear, named representative to approach.

    Other majoritarian variants (comparative)

    • Two-round system (France): if no candidate wins an absolute majority in the first round, a run-off is held between the top candidates (typically the top two, though French rules allow more). This guarantees the eventual winner has majority support among those who vote in the final round, at the cost of requiring voters to return to the polls.
    • Alternative Vote (AV): voters rank candidates in order of preference; if no one wins an outright majority of first preferences, the lowest-placed candidate is eliminated and their votes redistributed according to second preferences, repeating until one candidate has a majority. AV was rejected by 67.9% to 32.1% in the UK’s 2011 referendum, on a turnout of 42%, following a campaign in which opponents (including senior Conservatives) characterised it as complex and unfair, while proponents (including the Liberal Democrats, who had secured the referendum as a condition of coalition) argued it would reduce wasted votes. Its rejection significantly set back the electoral reform movement in the UK.
    • Supplementary Vote (SV): a simplified two-preference version of AV, used in England for mayoral and police and crime commissioner elections until 2022, when the government reverted these elections to FPTP via the Elections Act 2022, a move critics argued reduced voter choice and disproportionately benefited larger parties in these contests.

    3. Proportional representation systems

    List PR

    Under list PR, parties publish a ranked list of candidates for each region or for the country as a whole, and seats are allocated to parties in proportion to their vote share, with the top names on each list taking the seats won. In closed list systems, voters can only choose a party, and the party determines who fills the seats; in open list systems, voters can also indicate a preference for individual candidates within a party’s list, affecting which of that party’s candidates are elected.

    The UK used a closed regional list system for European Parliament elections between 1999 and its departure from the EU. List PR is used nationally in the Netherlands (in its purest, near-perfectly proportional form, with a very low effective threshold) and in Israel, both of which regularly produce highly fragmented, multi-party parliaments and coalition governments.

    Single Transferable Vote (STV)

    STV uses multi-member constituencies (typically returning between three and six MPs/MSPs/councillors). Voters rank candidates in order of preference. A quota is calculated (the minimum number of votes needed to guarantee election, given the number of seats available), and candidates who exceed the quota on first preferences are elected, with their surplus votes redistributed according to next preferences; if no candidate reaches the quota, the lowest-placed candidate is eliminated and their votes redistributed, and the process repeats until all seats are filled.

    STV is used for elections to the Northern Ireland Assembly, for local government elections in Scotland and Northern Ireland, and nationally in the Republic of Ireland. It is generally regarded by electoral reformers as one of the most proportional and voter-friendly systems, since it combines proportionality with a genuine choice between candidates (including from within the same party) and preserves a form of constituency link, albeit to a group of MPs/MSPs rather than one.

    Additional Member System (AMS) / Mixed Member Proportional (MMP)

    AMS is a hybrid system combining constituency MPs elected by FPTP with additional “top-up” members elected from regional party lists, with the top-up seats allocated to correct the disproportionality produced by the constituency results, so that each party’s overall seat total more closely reflects its vote share. Voters typically cast two votes: one for a constituency candidate and one for a regional party list.

    AMS is used for elections to the Scottish Parliament and the London Assembly (the Welsh Senedd used AMS from 1999 to 2021 but has since moved to closed list PR, discussed below). Germany uses a similar system (Mixed Member Proportional) for the Bundestag, where the top-up mechanism is calibrated to produce close-to-perfect overall proportionality, subject to a 5% national vote threshold designed to keep very small or extremist parties out of parliament, a feature widely credited (rightly or wrongly) with contributing to the postwar stability of German coalition politics.

    Effects of PR systems

    Greater proportionality. By design, PR systems reduce the gap between a party’s vote share and its seat share. Scottish Parliament results under AMS have historically been far closer to proportional than Westminster results under FPTP for the same electorate, though AMS is only semi-proportional, since the constituency component still tends to favour larger parties before the list seats correct for this.

    Multi-party systems and coalition or minority government. PR tends to allow smaller parties to win seats roughly in line with their support, which fosters multi-party systems and makes single-party majorities less common.

    The Scottish Parliament has been governed by coalition (Labour-Lib Dem, 1999-2007) and minority SNP government for extended periods; the Senedd has similarly required coalition or cooperation agreements.

    This is often framed as either a strength (better reflecting a genuinely pluralistic society, forcing consensus-building) or a weakness (producing weaker, less decisive government and post-election deals that voters did not directly choose).

    Fewer wasted votes. Because seats are allocated more closely to vote share, PR systems reduce (though rarely eliminate entirely) the sense that voting for a smaller party is pointless, which some argue increases turnout and reduces tactical voting.

    Weaker constituency link (in list systems). Pure list PR, especially at a national rather than regional level, can sever the direct link between a representative and a specific geographic area, which critics see as reducing accountability. STV and AMS mitigate this to varying degrees.

    Complexity. PR systems, particularly STV with its quota calculations and multiple counting rounds, are less immediately intuitive to voters than simply marking an “X”, which was a significant line of attack during the 2011 AV referendum even though AV itself is not a PR system.

    Risk of extremist or single-issue party representation. Lower effective thresholds can allow small, sometimes fringe, parties into parliament, which is why systems such as Germany’s impose a minimum vote threshold (5%) before a party qualifies for list seats.


    The UK’s mixed electoral landscape

    One of the most useful points for evaluation is that the UK does not use a single electoral system consistently across its own institutions, which provides a built-in natural comparison:

    • Westminster general elections: FPTP
    • Scottish Parliament: AMS
    • Welsh Senedd: used AMS from 1999 to 2021, but following the Senedd Cymru (Members and Elections) Act 2024, the Senedd moved to a closed list PR system, first used at the May 2026 election. The Senedd was also enlarged to 96 members, elected across 16 constituencies each returning six Members, with seats allocated by the D’Hondt formula. Wales no longer uses AMS at all; every Member is now elected by closed list PR
    • Northern Ireland Assembly: STV
    • London Assembly: AMS (as of 2024, elected via the Additional Member System, after a change from the previous supplementary vote/list hybrid used for the mayoralty and a separate list system used for the Assembly)
    • London Mayor and other directly elected mayors, and Police and Crime Commissioners: reverted from Supplementary Vote to FPTP in 2022
    • Local council elections: FPTP in England, STV in Scotland, a mix in Northern Ireland

    This patchwork means students of UK Politics can compare, within a single political system, how the same voters, the same party system, and broadly the same political culture produce different outcomes and different governing arrangements under different electoral rules, which is a genuinely useful natural experiment for evaluation essays.


    Case study: the 2026 Senedd election under closed list PR

    The May 2026 Senedd election is a useful, up-to-date illustration of closed list PR in practice, and offers a direct contrast with the 2024 Westminster result discussed above. Plaid Cymru became the largest party for the first time since devolution began, winning 43 seats on 35.4% of the vote, with Reform UK entering the Senedd for the first time and becoming the second-largest party with 34 seats on 29.3% of the vote. Welsh Labour fell to third place with just nine seats, the first time Labour has not been the largest party in a Senedd election, while the Conservatives won seven seats, the Greens two, and the Liberal Democrats one.

    The Electoral Reform Society’s proportionality analysis, using the Loosemore-Hanby disproportionality (DV) measure (where a lower score indicates a more proportional result), calculated a DV score of 15.5 for the 2026 Senedd result, broadly in line with the average across previous Senedd elections.

    By contrast, the equivalent Westminster result in Wales at the 2024 general election produced a DV score of 47.4, against a longer-run Welsh average of 29.3 for general elections. The over-representation of the largest party (Plaid Cymru) was just 9.4 percentage points above its vote share, the lowest over-representation figure of any Senedd election to date, and the first time it has fallen below 10 points.

    This gives a concrete, current figure to cite when arguing that PR systems narrow the gap between vote share and seat share relative to FPTP, while the closed list format still drew criticism, including from the Electoral Reform Society itself, for giving voters no ability to choose between individual candidates within a party’s list.


    5. Comparative example: the United States

    The USA offers a useful contrast because it combines plurality elements with features that are majoritarian in effect but structured very differently from anything in the UK.

    The House of Representatives is elected via single-member plurality districts, functionally very similar to FPTP, and shares many of the same effects: a strongly entrenched two-party system (arguably even more rigid than the UK’s, since minor parties almost never win federal seats), and significant distortion caused by the drawing of district boundaries.

    Gerrymandering, the deliberate manipulation of district boundaries by state legislatures to advantage one party, is a distinctly American aggravation of the disproportionality problem inherent in plurality systems, and has become a major and recurring subject of litigation and political controversy.

    The Senate is not proportional to population at all: each state receives two senators regardless of population, meaning California (around 39 million people) has the same representation as Wyoming (around 580,000).

    This is a deliberate design feature of federalism rather than a proportionality failure, but it is often cited alongside the House and the Electoral College as evidence of a broader tension in the US system between majoritarian principles and structural protections for smaller states.

    The Electoral College, which formally elects the President, is a state-based, largely winner-takes-all system: in 48 of 50 states (Maine and Nebraska allocate some electors by congressional district), all of a state’s electoral votes go to whichever candidate wins the statewide popular vote, however narrow the margin.

    This can and has produced a president who lost the national popular vote, most notably George W. Bush in 2000 and Donald Trump in 2016. This is arguably a more extreme distortion than anything produced by UK FPTP, since it can invert the national result entirely rather than merely exaggerate the winning margin, and it channels the entire presidential campaign into a small number of competitive “swing states” while most of the country is barely contested.

    Comparing the UK and US cases together illustrates that plurality/majoritarian logic produces broadly similar effects (two-party dominance, safe versus competitive seats, disproportionality) wherever it is applied, but the severity and specific character of those effects depends heavily on the surrounding institutional design, such as how district boundaries are drawn and controlled, and whether the system operates at a single national level or is layered on top of a federal structure.


    Evaluating the systems: a comparative framework

    A-level mark schemes reward evaluation against explicit criteria rather than simple description. Useful criteria include:

    CriterionFPTP / majoritarian systemsPR systems
    Proportionality of votes to seatsWeak; can produce landslide majorities from a minority of the voteStrong (varies by type; list PR strongest, AMS semi-proportional)
    Government stability/decisivenessUsually strong, single-party majorities more likelyWeaker; coalition or minority government more common
    Voter choiceLimited to one “X”; little intra-party choiceGreater under STV and open list; limited under closed list
    Simplicity for votersVery simpleVaries; STV and list systems more complex than FPTP
    Constituency accountabilityStrong, single named MPVaries; strong under STV/AMS, weak under national list PR
    Representation of smaller/minor partiesPoorGood, subject to any threshold
    Risk of extremist representationLow (high effective threshold from constituency-level plurality)Higher without a formal threshold
    Government mandate clarityHigh: manifesto of the governing party can usually be enactedLower: coalition agreements often dilute or trade away manifesto commitments

    No system performs well on every criterion simultaneously; this trade-off, rather than any single “correct” answer, is the central analytical point examiners are looking for.


    Conclusion

    The underlying tension between plurality/majoritarian and proportional systems is a trade-off between decisiveness and accountability on one hand and fairness and representativeness on the other.

    FPTP delivers simple, usually stable, single-party government with a clear line of accountability, but at the cost of significant and sometimes extreme distortion between votes and seats, as starkly illustrated by the 2024 general election.

    PR systems correct that distortion and better reflect a pluralistic, multi-party society, but generally produce coalition or minority government, dilute the direct constituency link (in some variants), and require voters to engage with more complex ballots and counting processes.

    The UK’s own experience, using FPTP at Westminster while running AMS in Scotland and Wales and STV in Northern Ireland, provides a genuinely useful internal comparison, while the American case shows how majoritarian logic can produce even sharper distortions when layered onto federal structures such as the Electoral College.

    There is no electoral system that is neutral among these values; the choice of system is, in effect, a choice about which values a political system prioritises.


  • What if . . .

    Wales had used First Past the Post instead of Closed List Proportional in 2026?

    Welsh Parliament Elections 2026: Closed Proportional List vs First Past the Post Analysis

    An analytical comparison of the 2026 Senedd election results highlights the dramatic contrast between the actual Closed Proportional List system (introduced under the Senedd Cymru (Members and Elections) Act) and a hypothetical First Past the Post (FPTP) model.


    1. Executive Summary & Seat Comparison

    The 2026 Senedd election under the Closed Proportional List system resulted in a expanded 96 member parliament allocated across 16 multi member constituencies (6 members each) using the D’Hondt method. This produced a balanced, multi party assembly where Welsh Labour fell short of an absolute majority, forcing them to negotiate working arrangements or coalitions.

    Under FPTP, using 96 small single member constituencies, the exact same voting patterns would have delivered a sweeping Welsh Labour majority, severely underrepresenting non concentrated opposition parties across Wales.


    Seat Breakdown Comparison
    PartyActual Closed List Result (96 Seats)FPTP Result (96 Constituencies)FPTP Seat Share (%)Estimated Popular Vote Share (%)
    Welsh Labour416870.8%~35.0%
    Plaid Cymru221616.7%~22.0%
    Welsh Conservatives1699.4%~18.0%
    Reform UK1411.0%~16.0%
    Welsh Liberal Democrats322.1%~5.0%
    Welsh Green Party000.0%~4.0%

    2. Key Analytical Differences

    A. Majority Government vs Minority Governance

    • Closed List Outcome: Welsh Labour won 41 seats, leaving them 8 seats short of an overall majority (49 needed for a majority in a 96 seat Senedd). This forced the First Minister into cross party co operation or formal coalition building to pass legislation and budgets.
    • FPTP Alternative: Welsh Labour would have captured 68 out of 96 single member constituencies (70.8% of total seats) despite winning only around 35% of the popular vote.
    • Impact: FPTP would have handed Labour an absolute, unassailable 40 seat majority, granting them total legislative dominance without needing cross party consensus.

    B. Severe Disproportionality & Electoral Distortion

    • Reform UK: Under the Closed List system, Reform UK achieved a major breakthrough, winning 14 seats across the 16 multi member regions. Under FPTP, despite capturing roughly 16% of the vote nationwide, their vote was spread evenly across Wales rather than heavily concentrated, reducing them to just 1 single constituency seat (an immense “electoral deficit”).
    • Welsh Conservatives: Under the Closed List system, the Conservatives secured 16 seats. Under FPTP, right of centre voter fragmentation between Conservatives and Reform UK allowed Labour to win dozens of seats on low pluralities, slashing Conservative representation down to 9 seats located mostly in North East and West Wales.
    • Welsh Liberal Democrats: Under FPTP, the Lib Dems rely entirely on hyper concentrated rural strongholds (e.g. Mid and West Wales). They would secure 2 seats under FPTP compared to 3 under the proportional list system.

    C. Regional Concentration & List Dynamics

    • Plaid Cymru: Plaid Cymru retained strong geographic bases in Y Fro Gymraeg (Welsh speaking heartlands in the west and north). Under FPTP, they would have won 16 seats where their local vote share was dominant. However, the Closed List system yielded them 22 seats by ensuring their votes in south east urban areas were not wasted.

    3. Political Implications

    Summary: Switching from Closed List to FPTP shifts the Senedd from a consensual, multi party institution into a winner takes all assembly dominated by a single party.

    1. Democratic Legitimacy: FPTP creates a massive “manufactured majority” for the leading party. Welsh Labour translating 35% of the vote into over 70% of parliamentary seats creates severe questions surrounding democratic fairness.
    1. Opposition Fragmentation: Under the Closed List system, right of centre voters split between Reform UK and Conservatives were still able to elect regional representatives. Under FPTP, this split vote hands victory to Labour candidates in almost every valley and urban seat.
    1. Policy Dynamics: The Closed List system obliges the executive to negotiate with opposition parties. FPTP would allow single party rule, enabling the Welsh Cabinet to pass its policy agenda without compromise.

    4. Judgement: Which System Produced the More Democratic Outcome?

    When evaluating democratic legitimacy and representativeness, the Closed Proportional List system produced a significantly more democratic outcome for the 2026 Senedd election than First Past the Post (FPTP) would have done.


    The Case for Closed List Proportional Representation as the Superior Model

    Alignment Between Votes and Power
    Under the Closed Proportional List system, the political makeup of the Senedd directly reflects the actual preferences of the electorate. Parties securing significant support across Wales (such as Reform UK with ~16% and Plaid Cymru with ~22%) receive parliamentary representation aligned with their popular backing.
     
    Under FPTP, roughly a third of all voters supporting Reform UK and the Conservatives in industrial and urban seats would receive zero local representation, leading to widespread voter frustration.
     
    Prevention of Unearned Dominance
    FPTP would have granted Welsh Labour over 70% of the parliamentary seats on barely more than a third of the total vote. A system that translates a minority vote into complete legislative control undermines the core principle of equal vote value.
     
    Proportional representation ensures that a party must secure broader public support before gaining complete command of the legislature.
     
    Reduction of Wasted Votes
    By grouping Wales into 16 large multi member constituencies returning six members each, the Closed List system ensures that almost every vote contributes toward electing an MS. This eliminates the vast safe seats and wasted votes typical of single member FPTP constituencies.


    Final Conclusion: While FPTP guarantees single party dominance and swift decision making, it does so by distorting the popular will. The Closed Proportional List system produced the more representative and democratic outcome, ensuring the Senedd accurately reflects the political diversity of Wales.


  • What if . . .

    Scotland has used FPTP instead of AMS in 2026?

    Scottish Parliament Elections 2026: AMS vs First Past the Post Analysis

    An analytical comparison of the 2026 Scottish Parliament election results highlights the dramatic contrast between the actual Additional Member System (AMS) and a hypothetical First Past the Post (FPTP) model.

    1. Executive Summary & Seat Comparison

    The 2026 Holyrood election under AMS resulted in a fragmented, highly proportional parliament with six parties represented, forcing the Scottish National Party (SNP) to form a minority administration.

    Under FPTP, the exact same constituency voting patterns would have produced a landslide SNP majority, virtually wiping out major opposition parties in the chamber.

    Seat Breakdown Comparison

    PartyActual AMS Result (129 Seats)  FPTP Result (73 Constituencies)FPTP Seat Share (%)Actual Vote Share (%) (Constituency)
    Scottish National Party (SNP)58  5778.1%38.2%
    Scottish Liberal Democrats10  79.6%~10.0%
    Scottish Conservative Party12  45.5%~12.0%
    Scottish Labour Party17  22.7%19.2%
    Scottish Green Party15  22.7%~2.3%
    Reform UK17  00.0%15.8%

    2. Key Analytical Differences

    A. Majority Government vs Minority Governance

    • AMS Outcome: The SNP won 58 seats, leaving them 7 seats short of an overall majority (65 needed). This required First Minister John Swinney to lead a minority government dependent on cross-party negotiation.
    • FPTP Alternative: The SNP would have secured 57 out of 73 constituency seats (78.1% of total seats) despite winning under 39% of the constituency vote.
    • FPTP would have granted the SNP absolute legislative control and an unassailable 21-seat majority in a 73-seat chamber.

    B. Severe Disproportionality & Electoral Distortion

    • Reform UK: Under AMS, Reform UK secured a major breakthrough, winning 17 regional list seats to become joint second-largest party alongside Labour. Under FPTP, despite taking 15.8% of the constituency vote nationwide, they won 0 constituency seats due to their vote being evenly dispersed rather than concentrated.
    • Scottish Labour: Under AMS, Labour took 17 seats (15 coming via regional top-up lists). Under FPTP, despite capturing nearly a fifth of the popular vote, Labour would have been reduced to just 2 seats (Na h-Eileanan an Iar and Edinburgh Southern).
    • Scottish Liberal Democrats: The Lib Dems were the primary beneficiary of geographical concentration among non-SNP parties. By winning 7 local constituency seats (e.g. in the Highlands, Islands, and East Dunbartonshire), FPTP would have made them the main official opposition party in Holyrood, despite placing fifth in national vote share.

    C. Urban Concentration & Third-Party Breakthroughs

    • Scottish Greens: The Greens achieved their strongest Holyrood result in history under AMS with 15 seats. Crucially, they won two direct constituency seats (Glasgow Southside and Edinburgh Central). Under FPTP, while they would have retained representation via those two seats, they would have lost 13 list seats, curtailing their parliamentary influence.

    3. Political Implications

    Summary: The choice of electoral system fundamentally shifts Holyrood from a consensual, coalition-driven parliament into a winner-takes-all institution.

    1. Democratic Legitimacy: FPTP creates a huge “manufactured majority” for the leading party. The SNP’s 38.2% vote share translating into 78.1% of seats would have heightened debate around electoral fairness.
    1. Opposition Realignment: Under AMS, right-of-centre opposition fragmented between Reform UK (17 seats) and Conservatives (12 seats). Under FPTP, this split vote benefited the SNP across central and north-east Scotland, suppressing conservative representation altogether.
    1. Policy Dynamics: AMS compels the government to negotiate budgets and key legislation with other groups. FPTP would have allowed single-party rule, enabling the SNP to execute its legislative agenda unimpeded.

    4. Concluding Judgement: Which System Produced the More Democratic Outcome?

    When evaluating democratic legitimacy and representativeness, the Additional Member System (AMS) unequivocally produced a more democratic and representative outcome for the 2026 election than First Past the Post (FPTP) would have done.

    The Case for AMS as the Superior Model

    1. Alignment Between Votes and Power
      • Under AMS, the composition of the Scottish Parliament closely reflects the actual choices of the electorate. Parties securing substantial nationwide support (such as Labour with 19.2% and Reform UK with 15.8%) receive parliamentary representation proportional to their popular mandate.
      • Under FPTP, over 35% of the total vote cast for Labour and Reform UK combined would have yielded just 2 seats out of 73 (less than 3% of the parliament), creating a massive “democratic deficit”.
    1. Prevention of Unearned Dominance
      • FPTP would have granted the SNP an absolute majority of nearly 80% of seats on less than 39% of the constituency vote. A system that translates a minority of votes into an overwhelming, uncheckable majority undermines the principle of equal vote value.
      • AMS ensures that a party must win broad, majority approval across the nation before gaining total legislative control.
    1. Pluralism and Voter Engagement
      • By ensuring that almost every vote contributes towards electing a representative (either at the local constituency level or through the regional list), AMS prevents millions of “wasted votes” in safe seats.
      • This multi-party setup encourages consensus-building, negotiation, and cross-party coalition, which better aligns with the constitutional ethos envisaged for devolved government in Scotland.

    Final Conclusion: While FPTP delivers decisive single-party government, it does so by distorting the popular will. AMS produced the significantly more democratic and representative outcome, ensuring Holyrood reflects the true political diversity of the Scottish electorate.


  • Electoral Systems used in the UK


    Electoral systems determine how votes cast by citizens are converted into seats in a legislature or council.

    Across the United Kingdom, several electoral systems operate concurrently across national, devolved, mayoral, and local elections.

    This reflects distinct democratic priorities, ranging from strong single-party government to local representation, voter choice, and proportional outcomes.


    1. First Past the Post (FPTP)

    Explanation

    First Past the Post is a single-member plurality voting system.

    The geographic area is divided into single-member constituencies or wards.

    Electors mark a single cross next to one candidate on the ballot paper.

    The candidate who secures the highest number of votes in that constituency wins the seat, regardless of whether they achieve an absolute majority (over 50%) of the total vote cast.

    Types of Election Used In:

    • UK General Elections: Electing Members of Parliament (MPs) to the House of Commons.
    • English Local Council Elections: Electing local councillors in single-member wards across England.
    • Directly Elected Mayors in England: Electing combined authority metro mayors (for example, Greater Manchester, West Midlands) and local council authority mayors (such as the Mayor of London).

    Analysis & Evaluation

    FPTP prioritises a clear constituency link and aims to produce stable, single-party majority governments.

    However, it operates on a “winner-takes-all” basis, leading to high levels of disproportionality between a party’s nationwide vote share and its resulting percentage of parliamentary seats.

    It heavily penalises parties whose support is spread evenly across the nation while rewarding parties with concentrated regional voting bases.

    Strengths / Advantages:

    • Simplicity: Straightforward for voters to mark a single cross and easy for election officials to count quickly.
    • Strong Constituency Link: Every citizen has one single local MP or councillor directly accountable to their geographical area.
    • Decisive Governance: Frequently delivers single-party majority governments with clear mandates to pass legislation without complex coalition bargaining.
    • Barrier to Extremism: Prevents fringe or radical parties from winning seats unless their support is highly concentrated in specific geographic pockets.

    Weaknesses / Disadvantages:

    • High Disproportionality: Nationwide seat totals often bear little relation to overall vote percentages.
    • Wasted Votes & Safe Seats: Votes cast for losing candidates, or surplus votes for a winning candidate beyond what was needed, have no impact on the overall result, creating safe seats where one party dominates perpetually.
    • Tactical Voting: Forces voters to vote defensively for a second-choice party to stop their least favourite candidate from winning, rather than expressing a true preference.
    • Minority Rule: Governs the country through executive majorities backed by only a minority of the total electorate.

    Recent Uses and Outcomes

    • UK General Election (4 July 2024): The Labour Party secured a parliamentary majority of 412 seats (63.2% of all seats) despite winning 33.7% of the popular vote.
    • In contrast, smaller parties with geographically widespread support faced severe penalties: Reform UK and the Green Party collectively earned over 23% of the total vote but won only 2.7% of the seats (18 seats combined). 58% of all votes cast were non-effective (wasted).
    • English Mayoral Elections (May 2024): Following the Elections Act 2022, elections for English combined authority mayors and the Mayor of London switched from the Supplementary Vote (SV) to FPTP. In the London Mayoral election, Sadiq Khan was re-elected under simple FPTP plurality, securing 43.8% of the vote without secondary preference transfers.

    2. Additional Member System (AMS)

    Explanation

    The Additional Member System is a hybrid electoral system that combines First Past the Post with Proportional Representation. Voters cast two separate votes on their ballot paper:

    1. Constituency Vote: Elects a local representative using standard FPTP.
    2. Regional Vote: Elects additional representatives from a party list to achieve overall proportionality across a region.

    Regional list seats are allocated using a mathematical formula (the D’Hondt method) that compensates parties that were under-represented in the constituency results relative to their regional vote share.

    Types of Election Used In:

    • Scottish Parliament Elections: Electing Members of the Scottish Parliament (MSPs) to Holyrood.
    • London Assembly Elections: Electing Assembly Members to scrutinise the Mayor of London.

    (Note: Wales historically used AMS for Senedd Cymru elections from 1999 until 2021, but transitioned to a Closed List system in 2026).

    Analysis & Evaluation

    AMS balances direct local accountability with proportional representation. It retains a dedicated constituency representative while ensuring that smaller parties with substantial regional backing can win seats. However, it creates two distinct classes of representative: constituency members (accountable to a local electorate) and regional list members (accountable primarily to their party hierarchy).

    Strengths / Advantages:

    • Proportionality with Local Ties: Corrects the unfairness of FPTP while retaining a single local constituency representative for every elector.
    • Voter Split-Ticket Choice: Allows electors to vote for a local candidate from one party while casting their regional vote for a different party.
    • Reduces Wasted Votes: Ensures that votes cast for smaller parties on the regional list count directly toward electing representatives.
    • Prevents Single-Party Dominance: Encourages consensus politics, coalition building, and compromise in legislative bodies.

    Weaknesses / Disadvantages:

    • Two-Tier System: Creates tension between constituency representatives (who hold a direct local mandate) and list representatives (who have no specific local boundaries).
    • Party Hierarchy Control: Political party leaders control candidate ordering on regional lists, giving party elites significant power over who gets elected.
    • Strategic Gaming: Parties can attempt to game the system (for example, establishing separate list parties) to maximise regional top-up seats.
    • Counting Complexity: The D’Hondt allocation calculation is less intuitive to the general public than basic plurality counting.

    Recent Uses and Outcomes

    • Scottish Parliament Election (7 May 2026): The Scottish National Party (SNP) won 58 seats, remaining the largest party at Holyrood but falling seven seats short of an overall majority. The D’Hondt regional calculation compensated opposition parties, resulting in 17 seats for Labour, 17 for Reform UK, 15 for the Greens, 12 for the Conservatives, and 10 for the Liberal Democrats.
    • WHAT IF . . . Scotland had used FPTP instead of AMS in 2026?
    • London Assembly Elections (May 2024): Used alongside the mayoral contest to elect 25 assembly members (14 single-member constituency seats and 11 London-wide list seats).

    3. Single Transferable Vote (STV)

    Explanation

    The Single Transferable Vote is a preferential voting system used in multi-member constituencies. Voters rank candidates in numerical order of preference (1 for first choice, 2 for second choice, and so on).

    To secure election, a candidate must reach a specific vote threshold known as the Droop Quota:

    If a candidate exceeds the quota on first-preference votes, they are elected, and their surplus votes are transferred to remaining candidates based on voters’ secondary preferences. If no candidate meets the quota, the lowest-ranking candidate is eliminated, and their votes are redistributed until all seats are filled.

    Types of Election Used In:

    • Northern Ireland Assembly Elections: Electing Members of the Legislative Assembly (MLAs) to Stormont.
    • Local Government Elections in Scotland: Electing councillors across multi-member wards in all 32 Scottish local authorities.
    • Local Government Elections in Northern Ireland: Electing councillors across multi-member district electoral areas.

    Analysis & Evaluation

    STV is widely regarded as a voter-centric system because it maximises individual choice. Voters can rank candidates from the same party or across different parties. It produces proportional outcomes and virtually eliminates wasted votes through preference transfers. Its main drawbacks are the complexity of the counting process and the large size of multi-member boundaries, which can dilute the personal constituency connection.

    Strengths / Advantages:

    • Maximum Voter Choice: Electors can choose between multiple candidates from the same party, rank candidates across party lines, or vote for independents.
    • High Proportionality without Party Lists: Achieves proportional results without granting central party bosses control over candidate rankings.
    • Eliminates Safe Seats: Candidates within the same party must compete against one another for voter preferences, driving active local campaigning.
    • Cross-Community Consensus: Encourages candidates to appeal to secondary preferences outside their immediate core base, promoting moderation.

    Weaknesses / Disadvantages:

    • Complex Counting Process: Involves multiple rounds of quota calculations and fractional vote transfers, often taking days to yield final results.
    • Diluted Local Accountability: Multi-member constituencies are geographically large, meaning voters have several representatives rather than one dedicated individual MP.
    • Potential for Intra-Party Friction: Candidates from the same political party are forced to compete against each other for first-preference votes.
    • Coalition Instability: Regularly yields highly fragmented assemblies that require complex, protracted coalition negotiations.

    Recent Uses and Outcomes

    • Northern Ireland Assembly Election (5 May 2022): 90 Members (MLAs) were elected across 18 multi-member constituencies (5 seats per constituency). Sinn Féin won 27 seats with 29.0% of first-preference votes, becoming the largest party. The cross-community Alliance Party achieved major gains by attracting preference transfers from both nationalist and unionist voters, rising to 17 seats despite winning 13.5% of first-preference votes.
    • Scottish Local Government Elections (May 2022) & Northern Ireland Local Council Elections (May 2023): Used across multi-member wards to elect local councillors. In Scotland, STV regularly results in balanced local councils that require formal multi-party coalitions or administration agreements to govern.

    4. Closed Proportional List System

    Explanation

    In a Closed Proportional List system, multi-member electoral regions elect multiple representatives.

    Political parties publish an ordered list of candidates prior to polling day. Electors cast a single vote for a political party rather than an individual candidate.

    Seats are distributed among parties in proportion to their overall regional vote share using mathematical formulas like D’Hondt. Successful candidates enter office strictly in the pre-ordered sequence established by the party leadership.

    Types of Election Used In:

    • Senedd Cymru / Welsh Parliament Elections: Electing Members of the Senedd (MSPs) across six-member constituencies in Wales.
    • UK European Parliament Elections (Historically): Used across 12 UK regional constituencies to elect Members of the European Parliament (MEPs) prior to Brexit.

    Analysis & Evaluation

    This system offers near-perfect party proportionality, matching a party’s total vote share directly to its share of seats. It simplifies the voting process for electors.

    However, it places power in the hands of party officials who control list rankings. Voters cannot select individual candidates or alter list orders, removing direct candidate-level accountability.

    Strengths / Advantages:

    • Exact Party Proportionality: Ensures that a party’s total percentage of seats closely reflects its overall percentage of the popular vote.
    • Simplicity for the Elector: Highly straightforward on polling day; voters simply choose a single party logo or name.
    • Fairness to Small Parties: Enables smaller parties crossing regional vote thresholds to win representation proportional to their true public support.
    • Promotes Demographic Diversity: Party leaderships can structure their pre-ordered candidate lists to guarantee gender balance or minority representation.

    Weaknesses / Disadvantages:

    • Severed Local Connection: Voters elect a national or regional party slate, losing any single local MP accountable to their specific town or district.
    • Absolute Party Control: Candidates are beholden to party leaders who determine list placement, rather than to the electorate. Unpopular individuals can be shielded near the top of lists.
    • No Individual Candidate Choice: Electors cannot split their vote or select a preferred individual candidate within a party list.
    • Disproportionate Coalition Power: Small kingmaker parties can hold outsize leverage over major parties during post-election cabinet formation.

    Recent Uses and Outcomes

    • Senedd Cymru / Welsh Parliament Election (7 May 2026): Under the Senedd Cymru (Members and Elections) Act 2024, Wales officially replaced AMS with a Closed List Proportional System across 16 six-member constituencies. Plaid Cymru became the largest party with 43 seats on 35.4% of the vote, Reform UK entered the Senedd with 34 seats (29.3%), Welsh Labour fell to 9 seats (11.1%), the Conservatives won 7 seats, the Greens won 2 seats, and the Liberal Democrats won 1 seat.
    • UK European Parliament Elections (May 2019): Historically used across 12 UK regional constituencies prior to the UK’s withdrawal from the European Union.

    Detailed Comparative Matrix
    Electoral SystemPrimary UK ApplicationKey Strengths / AdvantagesKey Weaknesses / DisadvantagesImpact on Governance & Electorate
    First Past the Post (FPTP)– UK Parliament

    – English Local Councils

    – English Combined Authority Mayors
    – Simple and clear: Extremely easy to vote (single cross) and fast to count.

    – Direct local link: Every constituent has one single MP or councillor accountable to their area.

    – Decisive majorities: Often yields single-party governments with strong legislative mandates.

    – Extremism filter: Blocks radical parties without concentrated local voting bases.
    – Extreme disproportionality: Nationwide seat share frequently distorts popular vote share.

    – High vote wastage: Over 50% of votes cast can be non-effective (wasted).

    – Safe seat apathy: Reduces voter turnout in areas where one party dominates perpetually.

    – Encourages tactical voting: Drives voters to vote defensively rather than express true preference.
    – Favours stable single-party executives over compromise.

    – Creates significant legislative majorities on minority vote shares.

    – Concentrates political campaign resources entirely on a small number of swing seats.
    Additional Member System (AMS)– Scottish Parliament

    – London Assembly
    – Proportional yet local: Combines local constituency MPs with regional top-up seats.

    – Split-ticket voting: Gives voters two choices (one local person, one regional party).

    – Reduces wasted votes: Secondary regional votes actively shape final parliamentary totals.

    – Cross-party consensus: Discourages executive dominance and encourages inter-party compromise.
    – Two-tier representatives: Risk of friction between constituency MPs (local mandate) and list MPs (no local mandate).

    – Party list control: Party bosses control regional list rankings and candidate priority.

    – Complex calculation: Uses the D’Hondt formula, which is less transparent to ordinary voters.

    – Gaming risks: Parties can set up separate “dummy” lists to bypass top-up penalties.
    – Frequently produces minority governments or formal coalitions.

    – Delivers broader public representation while keeping a identifiable local representative.

    – Encourages negotiated policymaking and legislative scrutiny.
    Single Transferable Vote (STV)– Northern Ireland Assembly

    – Scottish Local Councils

    – Northern Ireland Local Councils
    – Maximum voter empowerment: Electors rank candidates numerically () across or within parties.

    – High proportionality without rigid lists: Reaches fair seat distribution without giving power to central party bosses.

    – No safe seats: Candidates from the same party must compete against each other for preferences.

    – Cross-community incentive: Candidates seek lower-order preferences from rival communities.
    – Complex counting procedure: Involves multiple rounds of quota calculations and vote transfers.

    – Diluted local link: Multi-member constituencies mean voters share several representatives.

    – Intra-party rivalry: Competing party candidates may target each other rather than opponents.

    – Fragmented assemblies: Can cause protracted coalition negotiations or deadlock.
    – Highly responsive to individual voter preferences.

    – Virtually eliminates wasted votes through automated transfer mechanisms.

    – Requires power-sharing executive agreements in deeply divided polities.
    Closed Proportional List– Senedd Cymru (Welsh Parliament)– Exact party proportionality: Matches regional seat percentage directly to total party vote percentage.

    – Maximum ballot simplicity: Voters make a single straightforward mark for their chosen party.

    – Fairness to small parties: Ensures any party reaching a regional threshold gets equal seat representation.

    – Balanced slates: Parties can structure lists to ensure demographic or gender balance.
    – Severed constituency link: Removes direct single-member local representative accountability.

    – Total party patronage: Party leaders hold absolute power over who tops candidate lists.

    – Zero individual choice: Electors cannot vote for an individual candidate or alter list ordering.

    – Outsize coalition leverage: Small fringe parties can hold excessive power during cabinet formation.
    – Maximises party-level democratic equity.

    – Elevates party platforms over personal candidate popularity.

    – Encourages coalition building and inter-party cooperation in legislative chambers.
    Evaluation and Conclusion

    The choice of electoral system across the United Kingdom reflects a fundamental conflict between competing democratic priorities:

    1. Governance vs. Fair Representation: First Past the Post prioritises executive strength, speed of decision-making, and direct local accountability at the expense of fairness and voter equity.
    1. Proportionality vs. Candidate Choice: Hybrid systems like AMS attempt to bridge the gap between FPTP and PR, whereas STV prioritises voter empowerment and proportionality without granting central party bosses control over lists.
    1. Party Control vs. Local Link: Closed Proportional List systems maximise party fairness and simplify voting, but complete list closure severs individual constituent representation and concentrates authority inside central party headquarters.

    The divergence across Westminster, Holyrood, Cardiff Bay, Stormont, and local government demonstrates that no single voting model satisfies all democratic requirements.

    Each system offers distinct structural strengths and trade-offs depending on whether the priority is single-party stability, local representation, proportional outcome, or voter choice.