Author: HISTPO_Admin

  • Congressional Midterm Elections

    Edexcel A-level Politics, Paper 3: Comparative Politics (USA) | also relevant to AQA Paper 2: Government and Politics of the USA

    “If we do it, we will never lose the midterms, and we will never lose the general election, because we will have produced so many different things for our people, for the people, for the country, that it would be impossible to lose.”

    President Donald Trump made this claim to Republican lawmakers in May 2026, months before voters went to the polls in the November 2026 midterm elections. It is a bold prediction to test, because the political science on midterm elections is unusually consistent: the president’s party has lost House seats in nearly every midterm election of the last 90 years, regardless of who is in the White House.

    This page uses that historical pattern, the competing explanations for it, and the evidence available (as of July 2026) on the 2026 elections themselves, to test whether Trump’s prediction holds up, and to reach a reasoned judgement on how far midterm elections really are beyond a president’s control. We will re-visit Trump’s claim at the foot of this page and this page itself will be updated after the 2026 mid-terms.

    1. What are midterm elections, and why do they matter?

    Midterm elections take place two years into a president’s four-year term. All 435 seats in the House of Representatives and a third of the 100 Senate seats are contested, but the presidency itself is not on the ballot. This makes midterm elections, in effect, a national verdict on a sitting president delivered without the president standing for re-election.

    Midterm elections matter constitutionally and politically. A president who loses control of one or both chambers of Congress faces divided government (a situation in which one party holds the presidency while the other controls one or both chambers of Congress), which can block their legislative agenda, block appointments to the federal judiciary and executive branch, and expose the administration to congressional investigation. The clearest example is 2018: Democrats retook the House, used their new subpoena and committee powers to investigate President Trump’s conduct, and voted to impeach him in December 2019, something that would have been constitutionally impossible without their midterm victory.

    Key terms
    Midterm elections: congressional elections held two years into a president’s four-year term, when all House seats and about a third of Senate seats are contested but the presidency is not.
    Coattail effect: the tendency of candidates from the president’s party to win extra seats because of the president’s own popularity at the top of the ticket in a presidential election year; midterms remove this effect entirely.
    Generic ballot: an opinion poll question asking voters which party, rather than which named candidate, they intend to support in their local congressional race, e.g. “Democrats 46%, Republicans 43%”; used as a rough national proxy for the House popular vote.
    Divided government: a situation in which one party controls the presidency while the other controls one or both chambers of Congress, a common outcome of midterm elections.
    Check your understanding
    1. Explain why the absence of the coattail effect makes midterm elections structurally different from presidential-year congressional elections.
    2. Using the 2018 example, explain one way in which losing a midterm election can constrain a president even though the presidency itself was not contested.

    2. The historical pattern: the president’s party almost always loses

    Since Franklin D. Roosevelt’s presidency, the president’s party has lost House seats in nearly every midterm election bar two: 1998 and 2002. Averaged across the 22 midterm elections between 1934 and 2018, the president’s party has lost 28 House seats and four Senate seats. The table below sets out the results since 1994, the point at which the modern, highly nationalised pattern of midterm politics (beginning with the Republican Revolution) took shape.

    1994ClintonDem−54−8The Republican Revolution, led by Newt Gingrich’s Contract with America; Republicans took both chambers for the first time since 1953.
    1998ClintonDem+50First midterm gain for a president’s party since 1934. Backlash against Republican pursuit of the Lewinsky impeachment, combined with a strong economy and Clinton approval above 60%.
    2002G. W. BushRep+8+2Post-9/11 national security environment pushed Bush’s approval above 60%; only the second president since 1934 (after FDR) to gain seats in both chambers at a midterm.
    2006G. W. BushRep−31−6Iraq War unpopularity and Bush’s sixth year in office (the Six-year itch); Democrats retook both chambers, 232–203 in the House.
    2010ObamaDem−64−6Tea Party wave; backlash against the Affordable Care Act and the 2009 stimulus. Largest House loss for either party since 1948.
    2014ObamaDem−13−9Obama’s sixth year (the Six-year itch again); low approval amid the Ebola and ISIS news cycles; Republicans took the Senate.
    2018TrumpRep−40+2Referendum on Trump’s first two years; Democrats retook the House and later impeached Trump (December 2019).
    2022BidenDem−9+1Smallest midterm loss for a president’s party in 20 years, widely attributed to backlash against the Supreme Court’s Dobbs v Jackson ruling overturning the constitutional right to abortion.

    Source: House and Senate seat changes, 1994–2022, compiled from Ballotpedia and Britannica election results.

    The two genuine exceptions, 1998 and 2002, share a common feature: both occurred when presidential approval was unusually high (above 60%), driven by extraordinary national circumstances (impeachment and the aftermath of 11 September 2001 respectively) rather than by normal political conditions. This points to presidential approval, not the mere fact of being a midterm, as the underlying variable that really explains the pattern.

    Check your understanding
    1. Identify and explain two features shared by the 1998 and 2002 midterms that made them exceptions to the usual pattern.
    2. Using the table, compare the scale of losses in 2010 and 2022. What does the difference suggest about the relationship between a president’s approval rating and the size of their party’s midterm losses?

    3. Explaining the pattern: competing theories

    Political scientists offer several, overlapping explanations for why the president’s party so reliably loses ground at midterms.

    Key terms
    Surge and decline theory: developed by the political scientist Angus Campbell, the idea that turnout and enthusiasm “surge” for the president’s party in a presidential election year because of the coattail effect, then “decline” at the following midterm as many less-engaged, short-term voters stay home, leaving a more oppositional electorate.
    Six-year itch: the tendency for a president’s party to suffer even heavier midterm losses in the sixth year of a presidency (the second midterm of a two-term presidency) than in the first midterm, as accumulated grievances and “time for a change” sentiment build.
    Incumbency advantage: the electoral benefit sitting members of Congress enjoy from name recognition, campaign funding and constituency casework, which normally makes midterms less volatile at the level of an individual district than the national swing alone would suggest.

    Evaluating the coattail effect

    Because the Coattail effect is the mechanism that produces the initial “surge” in surge and decline theory, it is worth evaluating separately how strong that surge still is. Split-ticket voting, where a district backs a presidential candidate from one party and a House candidate from another, is the clearest evidence of coattails at work, and it has collapsed over the last fifty years.

    YearSplit-ticket districtsShareNote
    1972190 of 43544%High-water mark of candidate-centred, locally-focused congressional voting.
    1988145 of 43533%Split-ticket voting still common before the nationalisation of American politics.
    201226 of 4356%Sharp fall as partisan polarisation hardens under Obama.
    201635 of 4358%Small uptick, but still historically low.
    202016 of 4354%Lowest share on record; near-total alignment between the presidential and House vote by district.
    202416 of 17 flipped districts matched the presidential winnern/aTrump’s coattails were, in Brookings’ phrase, “short”: Republican House gains came mainly from a collapse in Democratic turnout rather than new voters drawn in by Trump himself.

    Source: Pew Research Center (2016); Axios (2022); The Downballot and Brookings analysis of 2024 results.

    Two patterns stand out, and they point in slightly different directions:

    • The near-disappearance of split-ticket districts, from 44% in 1972 to under 4% in 2020, shows that voters increasingly treat their House vote as an extension of their presidential vote. This suggests that national partisan identity, rather than an individual president’s personal appeal, is now the main force aligning presidential and congressional results, a more structural explanation than the Coattail effect implies.
    • Even so, the strength of that alignment does not mean presidents actively pull new voters down-ballot. In 2024, Republican House candidates gained relatively little from an increase in their own vote, and far more from a 6.6 million fall in the Democratic vote compared with 2020; ticket-splitting persisted at the margins, with 19.7% of Black voters who backed Trump nonetheless voting for the Democratic House candidate, against only 3.6% of Harris voters crossing over the other way.
    • This matters directly for 2026: if the Republican “surge” in 2024 was already shallow, resting on Democratic turnout collapse rather than a genuine coattail pull towards Trump and congressional Republicans together, then the equivalent “decline” facing Republicans in 2026 may be smaller in raw vote-share terms than the historical pattern in Section 2 would suggest. This is cold comfort for Republicans in practice, however, because their 3-seat House majority leaves almost no cushion against any decline at all, however modest.

    On balance, the coattail effect is a weaker explanation for 2026 than surge and decline theory or presidential approval. Split-ticket voting’s collapse shows that district-level results now track national partisanship closely, but the 2024 evidence suggests this is closer to a permanent, polarised alignment between two committed electorates than to presidents actively expanding their party’s support down the ballot, reinforcing why a small number of genuinely competitive, newly gerrymandered districts, rather than a broad coattail wave in either direction, are likely to decide control of the House in November 2026.

    Referendum theory holds that voters use the midterm election to pass judgement on the president’s performance, even though the president is not on the ballot. A 2014 Gallup poll found that 52% of registered voters said their vote was intended to send Barack Obama a message, and of that group, around 32 percentage points wanted to send a message of opposition against only 20 of support, evidence that midterm voting behaves like a national verdict on the presidency rather than a series of local judgements on individual House members.

    The strongest single predictor is presidential approval itself. Gallup’s analysis of midterms since 1946 found that presidents with approval below 50% saw their party lose an average of 37 House seats, compared with an average loss of only 14 seats for presidents above 50% approval, a stark illustration of why 1998 and 2002 (both above 60% approval) broke the usual pattern.

    The Six-year itch is a more specific version of the same logic. Since the Second World War, the president’s party has lost an average of around 15 House seats at a first midterm but around 48 at a second-term (sixth-year) midterm; the pattern is clearer in the Senate than in the House, and some political scientists question whether it is a distinct effect at all rather than simply presidents’ approval ratings naturally eroding over two terms. This matters for 2026: because Trump’s two terms were non-consecutive (2017–2021, then 2025–), November 2026 is technically his first midterm of this presidency, analogous to 2018 rather than to a classic sixth-year itch election, even though six years have now passed since he first took office.

    Check your understanding
    1. Explain, in your own words, the difference between surge and decline theory and referendum theory as explanations for midterm losses.
    2. Using the split-ticket voting data, evaluate whether the Coattail effect or partisan polarisation better explains why presidential and House results have converged since 1972.
    3. Evaluate the claim that presidential approval rating is the single most important factor in explaining the scale of a president’s party’s midterm losses. Use figures from this section to support your answer.

    4. Turnout: who actually shows up?

    Part of the explanation for midterm volatility lies in who turns out to vote. Midterm turnout is consistently far lower than presidential-year turnout, and the electorate that does turn out tends to be older, more partisan and more likely to be motivated by opposition to the sitting president.

    YearElection typeTurnoutNotes
    2018Midterm49%Highest midterm turnout since 1914, driven by high engagement on both sides in the first Trump-era midterm.
    2020Presidential66%Highest turnout rate for any US national election since 1900.
    2022Midterm46%Exceeded every midterm since 1970, though still 20 percentage points below the 2020 presidential turnout.
    2024Presidential64%Second-highest presidential turnout on record, tied with 1960.

    Source: Pew Research Center, “Voter turnout in US elections, 2018–2022” and “Voter turnout in the 2020 and 2024 elections” (2025).

    Even accounting for the unusually high turnout of the 2018 and 2022 midterms, the pattern holds: average presidential-year turnout from 1972 to 2024 was around 58%, against average midterm turnout of around 41%, a 17-point gap. Because the voters who drop off between a presidential year and the following midterm are disproportionately less partisan, low-propensity voters, the electorate that remains is skewed towards the more committed and often more oppositional voters of the party out of power, reinforcing the losses predicted by surge and decline theory.

    5. Gerrymandering, redistricting and the 2026 map

    One complicating factor for 2026 is that the electoral map itself has changed since the last election. Congressional districts are normally redrawn only once a decade, after the census, but a wave of mid-decade redistricting (redrawing outside the normal ten-year cycle) began in summer 2025 when Trump asked Texas Republicans to redraw their map to create additional Republican-leaning seats.

    This is constitutionally possible because of the Supreme Court’s 2019 ruling in Rucho v. Common Cause, which held that claims of excessive partisan gerrymandering (the deliberate drawing of district boundaries to advantage one party) present a “political question” beyond the reach of the federal courts, leaving state legislatures largely free to gerrymander for partisan advantage so long as they do not breach separate protections against racial discrimination.

    StateDriving partyProjected impactStatus
    TexasRepublicanUp to 5 seatsNew map passed by the legislature in 2025, targeting Democratic-held districts; subject to ongoing federal litigation.
    MissouriRepublican1 seatNew map passed in autumn 2025 as part of the same push.
    North CarolinaRepublican1–2 seatsNew map passed October 2025.
    OhioRepublican1–2 seatsNew map approved by the state redistricting commission in October 2025.
    CaliforniaDemocratUp to 5 seatsCounter-map approved by California voters in a November 2025 ballot measure, in direct response to the Texas move.
    UtahDemocrat1 seatCourt-ordered redraw produced a more competitive map.
    VirginiaDemocratUp to 3 seats (pending)New Democratic-favourable map awaiting final approval as of mid-2026.

    Source: Ballotpedia, “Redistricting ahead of the 2026 elections”; Democracy Docket redistricting tracker (2026).

    Nationally, this leaves Republican-led states pursuing roughly nine additional Republican-leaning seats (concentrated in Texas, Missouri, North Carolina and Ohio) against a Democratic counter-push of a similar magnitude concentrated in California, Utah and potentially Virginia. The practical effect is that, for the first time in the modern redistricting era, both parties have partially redrawn the battlefield mid-cycle in direct response to each other, meaning the 2026 result will reflect not only the underlying national mood but also which side’s redistricting gamble pays off in court and at the ballot box.

    Gerrymandering is treated here only as it affects the 2026 midterm result. A fuller evaluation of gerrymandering as a question of representation, including how well Congress reflects the electorate and the case for reform, follows in the later study notes on the functions of Congress.

    Check your understanding
    1. Explain why Rucho v. Common Cause made the 2025–2026 mid-decade redistricting wave constitutionally possible.
    2. Using the table, evaluate whether the redistricting battle is likely to help or hinder the Republican Party’s chances of retaining the House in 2026.

    6. Case study: the November 2026 midterms

    Going into the 2026 midterms, Republicans hold a narrow 218–214 House majority (with three vacancies) and a 53–47 Senate majority (counting the two independents who caucus with Democrats). This means Democrats need a net gain of only three House seats and four Senate seats to win control of each chamber respectively, while Republicans can afford to lose no more than two seats in either chamber.

    IndicatorFigureAs ofInterpretation
    Trump approval38–40%late July–August 2026 (Gallup, Silver Bulletin)Firmly in the “below 50%” band that Gallup associates with an average 37-seat House loss for the president’s party.
    Generic ballotDemocrats +3 to +7July–August 2026 (Decision Desk HQ, other trackers)Consistent, if variable, Democratic lead; comparable in scale to the leads seen before the 2018 and 2006 Democratic wave years.
    2026 shutdownsTwo shutdowns, Jan–Feb and Feb–Apr 2026resolved by 30 April 2026Both stemmed from disputes over federal immigration enforcement following the killing of Alex Pretti by Customs and Border Protection agents; contributed to a decline in Trump’s approval.
    Forecast modelsDemocratic gain of roughly 20–35+ House seats; Senate a toss-up leaning Republicanmid-2026 model projections (USPollingData.com)A modelled projection, not a certainty; the Senate map (which states are up) structurally favours Republicans regardless of national mood.

    Source: Gallup, Silver Bulletin, Decision Desk HQ and USPollingData.com polling and forecast trackers, accessed 1 August 2026; figures are subject to change before polling day in November 2026.

    It is worth being precise about what this evidence can and cannot show in August 2026.

    Approval ratings and generic ballot polling are strong historical predictors of the direction and rough scale of midterm losses, but they are not the result itself, and forecast models built from them carry real uncertainty, particularly for the Senate, where the specific seats being contested in any given cycle can matter more than the national mood.

    What the evidence does show clearly is that every major indicator, approval, the generic ballot, and the precedent of two damaging government shutdowns, points in the same direction: towards a difficult midterm for the president’s party, consistent with the historical pattern rather than an exception to it.

    Check your understanding
    1. Using the table, explain why the Senate is described as a “toss-up leaning Republican” even though Trump’s approval rating is low.
    2. “Polling evidence in August 2026 makes a Republican defeat in November 2026 a certainty.” To what extent do you agree with this statement? Use evidence from this section in your answer.

    7. Evaluation: how far are midterms beyond a president’s control?

    The evidence points overwhelmingly in one direction. In 80 years of midterm elections since Franklin D. Roosevelt, only two presidents (Clinton in 1998 and Bush in 2002) have avoided losing House seats, and both did so only because of extraordinary, short-lived circumstances that pushed their approval above 60%. Trump’s approval in 2026, at 38–40%, sits squarely within Gallup’s “unpopular president” band, associated historically with an average House loss of 37 seats, more than enough to end Republican control of the chamber given their three-seat margin.

    The Democratic generic ballot lead of 3–7 points in mid-2026 is consistent with, rather than contradicting, this historical pattern; leads of this size preceded both the 2006 and 2018 Democratic wave elections. Set against this, the Six-year itch literature and the two 2026 government shutdowns both point towards accumulated, rather than fresh, discontent, exactly the conditions historically associated with larger, not smaller, midterm losses.

    The genuine complicating factor is redistricting. Because roughly nine Republican-leaning seats have been engineered in Texas, Missouri, North Carolina and Ohio, partly offset by a similar number of Democratic-leaning seats in California, Utah and potentially Virginia, the relationship between national vote share and seats won is less predictable in 2026 than in a normal, map-stable midterm such as 2010 or 2018.

    This means that even if Democrats win the national popular vote for the House by a margin similar to 2018 (roughly 8–9 points), the number of seats that changes hands could diverge more than the historical pattern alone would predict, in either direction, depending on which side’s redrawn maps hold up in court and at the ballot box.

    Weighing this evidence, Trump’s claim that Republicans “will never lose the midterms” in 2026 runs directly against 80 years of precedent, an approval rating in the range historically associated with a roughly 37-seat loss, and a consistent Democratic generic ballot lead. It is very difficult to reconcile with the evidence available in August 2026. What is genuinely uncertain, and what the historical pattern alone cannot settle, is not whether Republicans will lose ground but how much ground they will lose, given that the 2025–2026 redistricting wave means the 2026 map is not the same map that produced the historical pattern in the first place.

    The nearest UK equivalent, using local and by-elections as a barometer of a governing party’s mid-term popularity (for example the May 2025 local elections), is developed in more detail elsewhere on histpology.co.uk.

    Where this page began . . .

    “If we do it, we will never lose the midterms, and we will never lose the general election, because we will have produced so many different things for our people, for the people, for the country, that it would be impossible to lose.”

    Tested against the evidence available as this page was written, in early August 2026, Trump’s May 2026 claim does not hold: historical precedent, Trump’s own approval rating, and a consistent Democratic generic ballot lead all point towards Republican losses in November 2026, in line with the pattern that has held in 36 of the last 38 midterm elections.

    The genuinely open question, deliberately left unresolved by a single opinion poll or historical average, is whether the unprecedented mid-decade redistricting fight of 2025–2026 will cushion the scale of those losses enough to let Republicans cling on to one or both chambers of Congress, a live test of the historical pattern that only the November 2026 results themselves can finally settle.

    Check your understanding
    1. Drawing on the whole document, construct a two-paragraph answer to the question: “Explain and evaluate the extent to which US congressional midterm elections are a referendum on the sitting president.”
    2. Identify one piece of evidence in this document that supports Trump’s May 2026 prediction, and one that contradicts it. Which do you find more persuasive, and why?
    3. To what extent has mid-decade redistricting weakened the usefulness of historical midterm patterns as a predictive tool? Use specific figures from Section 5 in your answer.

    Sources

    Primary sources

    Rucho v. Common Cause, 588 U.S. 684 (2019).

    Secondary sources

    Axios, “The number of districts that split tickets for Congress and president is plummeting” (2022).

    Ballotpedia, “Redistricting ahead of the 2026 elections” (2026).

    Ballotpedia, “United States Congress elections, 2026” (2026).

    Britannica, “United States midterm elections” (2026).

    Brookings, “President-elect Trump’s short coattails” (2024).

    Congressional Research Service, “The 2025 (FY2026) Government Shutdown: Economic Effects”, Congress.gov, R48832 (2026).

    Decision Desk HQ, “Where the polls stand as Decision Desk HQ launches its 2026 forecast” (2026).

    Democracy Docket, “Live Redistricting Tracker” (2026).

    Gallup, “Midterm Seat Loss Averages 37 for Unpopular Presidents” (2018).

    Pew Research Center, “Split-ticket districts, once common, are now rare” (2016).

    Pew Research Center, “Voter turnout in US elections, 2018–2022” (2023).

    Pew Research Center, “Voter turnout in the 2020 and 2024 elections: A detailed analysis” (2025).

    The Conversation, “For 80 years, the president’s party has almost always lost House seats in midterm elections…” (2026).

    The Downballot, “The Downballot’s 2024 presidential results for all 435 House districts” (2024).

    USPollingData.com, “2026 Midterm Elections Forecast” (2026).
  • Congressional elections in the USA – Overview


    The United States Congress is the national legislature (law-making body) established under Article I of the Constitution. Congress is bicameral, meaning it is divided into two chambers: the House of Representatives and the Senate. This structure was the outcome of the Great Compromise (also called the Connecticut Compromise) of 1787, which reconciled the competing demands of larger states, who wanted representation based on population, and smaller states, who wanted equal representation regardless of size. The two chambers differ significantly in their size, term length and basis of representation, and elections to each follow a different rhythm. Understanding these differences is essential background before considering how congressional election campaigns are fought and funded.

    Key terms
    Bicameral: having two legislative chambers. In Congress, these are the House of Representatives and the Senate.
    Single-member plurality system: an electoral system (also known as first-past-the-post) in which the candidate with the most votes in a district wins the seat outright, even without an overall majority.
    Midterm election: a congressional election held halfway through a president’s four-year term, when the presidency itself is not on the ballot.

    The structure of Congress

    Congress’s two chambers differ sharply in size, term length and the way they represent the population. The House of Representatives is the larger chamber and is meant to reflect the population directly, while the Senate gives every state, however small, an equal voice. This balance between population-based and state-based representation remains the defining feature of Congress’s structure.

    FeatureHouse of RepresentativesSenate
    Number of members435 voting members, plus six non-voting delegates from US territories and Washington, DC100 members
    Basis of representationPopulation: seats allocated between states by apportionment and redrawn after each censusEqual representation: two senators per state, regardless of population
    Length of termTwo years; the whole House is re-elected at every congressional electionSix years, staggered across three classes, so roughly one-third of seats are contested at each election
    Current composition (August 2026)218 Republicans, 214 Democrats, 3 vacancies53 Republicans, 45 Democrats, 2 independents who caucus with the Democrats
    Presiding officerSpeaker of the House: Mike Johnson (Republican, Louisiana)President of the Senate: Vice President JD Vance (a largely ceremonial role); day-to-day floor management by Majority Leader John Thune (Republican, South Dakota)
    Minimum age and citizenshipAt least 25 years old; a US citizen for at least seven yearsAt least 30 years old; a US citizen for at least nine years

    Figures on party composition and leadership verified as of August 2026; see Congress.gov and Ballotpedia in Sources.

    Check your understanding
    1. Explain what is meant by describing Congress as bicameral.
    2. Why do the House of Representatives and the Senate use different bases of representation?
    3. To what extent does the Senate’s six-year, staggered term serve a different purpose from the House’s two-year term?

    The election process

    House elections use a single-member plurality system: each of the 435 districts elects one representative, and the candidate with the most votes wins the seat outright, even without an overall majority. Senate elections work on the same basis, but statewide, since each state elects its own senators individually. Before the general election in November, candidates must first win their own party’s nomination, usually through a primary election held earlier in the year. How district boundaries themselves are drawn, and the disputes this creates, is covered separately in a later section on electoral issues.

    Check your understanding
    1. Outline the stages a candidate goes through to be elected to the House of Representatives.
    2. Explain the difference between a primary election and a general election.

    The election cycle and midterm elections

    Congressional elections are held on a fixed day, the first Tuesday after the first Monday in November, in every even-numbered year. Every second cycle coincides with a presidential election; the cycle in between is a midterm election, so called because it falls midway through the president’s four-year term. All 435 House seats are contested at every cycle, alongside roughly a third of Senate seats. The table below shows which party held the presidency, and which party controlled each chamber, at every congressional election since 2000.

    YearElection typePresident in powerHouse control (after election)Senate control (after election)
    2000Presidential electionBill Clinton (Democrat)Republicans, 221–212 (2 independents)Split 50–50 (Republicans controlled via Vice President Dick Cheney’s tie-breaking vote)
    2002Midterm electionGeorge W. Bush (Republican)Republicans, 229–205 (1 independent)Republicans, 51–49 (48 Democrats plus 1 independent caucusing with Democrats)
    2004Presidential electionGeorge W. Bush (Republican)Republicans, 232–202 (1 independent)Republicans, 55–45 (44 Democrats plus 1 independent caucusing with Democrats)
    2006Midterm electionGeorge W. Bush (Republican)Democrats, 233–202Democrats, 51–49 (49 Democrats plus 2 independents caucusing with Democrats)
    2008Presidential electionGeorge W. Bush (Republican)Democrats, 257–178Democrats, 59–41 (57 Democrats plus 2 independents caucusing with Democrats)
    2010Midterm electionBarack Obama (Democrat)Republicans, 242–193Democrats, 53–47 (51 Democrats plus 2 independents caucusing with Democrats)
    2012Presidential electionBarack Obama (Democrat)Republicans, 234–201Democrats, 55–45 (53 Democrats plus 2 independents caucusing with Democrats)
    2014Midterm electionBarack Obama (Democrat)Republicans, 247–188Republicans, 54–46 (44 Democrats plus 2 independents caucusing with Democrats)
    2016Presidential electionBarack Obama (Democrat)Republicans, 241–194Republicans, 52–48 (46 Democrats plus 2 independents caucusing with Democrats)
    2018Midterm electionDonald Trump (Republican)Democrats, 234–201Republicans, 53–47
    2020Presidential electionDonald Trump (Republican)Democrats, 222–213Split 50–50 (Democrats controlled via Vice President Kamala Harris’s tie-breaking vote)
    2022Midterm electionJoe Biden (Democrat)Republicans, 222–213Democrats, 51–49
    2024Presidential electionJoe Biden (Democrat)Republicans, 220–215Republicans, 53–47
    2026Midterm electionDonald Trump (Republican)Not yet known (election on 3 November 2026)Not yet known (election on 3 November 2026)

    Final seat counts after each election, verified via Ballotpedia and Wikipedia; figures can shift slightly after special elections and party switches. See Sources.

    • In every midterm election shown except 2002, the president’s party lost House seats; in four of these seven midterms, 2006, 2010, 2018 and 2022, this cost it control of the chamber outright.
    • The Senate has been decided by the narrowest possible margin, a 50–50 split resolved only by the Vice President’s tie-breaking vote, twice in this period, after the 2000 and 2020 elections.
    • 2002 remains the only midterm election since 2000 in which the president’s party, the Republicans under George W. Bush, gained seats in both chambers, a result widely linked to Bush’s high approval ratings after the September 2001 terrorist attacks.

    The reasons why the president’s party so often loses ground at a midterm election, illustrated by the results above, are analysed in more detail in a separate section.

    Check your understanding
    1. Using the table, identify which type of election, presidential or midterm, produced the largest swing against the president’s party.
    2. Explain why the same party does not always control the presidency, the House and the Senate at the same time.
    3. Explain what is meant by a midterm election, and why 2026 is a midterm year.

    Sources

    Primary sources

    US Constitution, Article I.

    Seventeenth Amendment to the US Constitution (1913).

    Secondary sources

    Ballotpedia, “United States Congress elections, 2026”.

    Ballotpedia, “Election results” pages for the 2000, 2002, 2004, 2006, 2008, 2010, 2012, 2014, 2016, 2018, 2020, 2022 and 2024 U.S. Congress elections.

    Congress.gov, Congressional Research Service, “Membership of the 119th Congress: A Profile”.

    Pew Research Center, “Republican Gains in 2022 Midterms Driven Mostly by Turnout Advantage” (2023).

    Pew Research Center, “Democrats Made Gains From Multiple Sources in 2018 Midterm Victories” (2020).

    Wikipedia, “107th” through “119th United States Congress” (used for cross-checking party composition figures).


  • Presidential Elections in the USA

    “The electoral college is a disaster for a democracy.” Donald Trump wrote this on Twitter on 6 November 2012, the day after Barack Obama’s re-election. Four years later, having lost the popular vote but won the presidency himself, he took the opposite view.

    “The Electoral College is actually genius in that it brings all states, including the smaller ones, into play. Campaigning is much different!”

    Donald Trump, tweet, 15 November 2016

    Trump’s reversal is a useful way into Presidential elections in the USA, because it captures a pattern that recurs across every strand of the topic: how a rule looks tends to depend on whether it currently favours you. The same pattern appears in how campaigns fund themselves, in how incumbents defend their record, and in how the parties argue over reforming the Electoral College itself. This page draws the topic’s separate strands, the structure of American elections, the Electoral College, campaign finance and incumbency, into a single fifteen-minute read, using the 2020 and 2024 elections and the early stages of the 2028 cycle as running examples throughout. It closes by returning to Trump’s two tweets to test whether his 2016 verdict still holds up in 2026.

    1. The Structure of US Presidential elections

    Before looking at the Electoral College in detail, it helps to see where the presidency sits within the wider American electoral system. The Constitution creates only the presidency directly; every other office below is a separate contest with its own electoral system, several of which shape the path to the White House long before the general election itself.

    LevelElectoral system usedRelevance to the presidency
    Local governmentMostly plurality (first past the post); a growing number of cities, for example New York, use ranked-choice votingTraditional entry point for a political career and local party organisation
    State legislaturesSingle-member plurality in most statesControl congressional redistricting, shaping House competitiveness
    GovernorshipsPlurality in most states; majority run-off in Georgia and LouisianaA common launch pad for presidential candidacies
    US House of RepresentativesSingle-member plurality, except Maine and Alaska, which use ranked-choice votingMidterm results are widely read as a referendum on the president
    US SenateStatewide plurality; run-off in Georgia; ranked-choice voting in Maine and AlaskaSenate control shapes a president’s ability to legislate and confirm appointments
    Presidential nominationPrimaries and a small number of caucuses; delegates allocated proportionally or winner-take-all depending on state and partyDetermines each party’s nominee before November
    Presidential general electionThe Electoral College: 538 electors, winner-take-all in 48 states and Washington DC, congressional district method in Maine and NebraskaAn indirect election in which the national popular vote does not determine the outcome, as in 2000 and 2016

    Source: adapted from AQA 7152 (3.2.1.5) and Edexcel 3A.5.1 specification content.

    • The Constitution supplies only the skeleton of this process: Article II establishes the presidency, a four year term and the Electoral College, while the Twelfth Amendment (1804), Twentieth Amendment (1933) and Twenty Second Amendment (1951) fix how electors vote, when a term begins, and how many terms a president may serve.
    • Everything that fills the gap is party practice rather than law: the invisible primary, the sequence of primaries and caucuses, and the national conventions appear nowhere in the constitutional text.
    • As of July 2026, the country is in the invisible primary for 2028, roughly twenty seven months before polling day, with the shape of the field still heavily dependent on this coming November’s midterm elections.

    Key terms
    Electoral College: the body of 538 electors, allocated by state, that formally elects the president and vice president rather than voters doing so directly.
    Invisible primary: the informal period of fundraising, positioning and organisation before any candidate formally declares a campaign.
    Delegate: a party representative who formally nominates a candidate at a national convention, having been allocated through primaries or caucuses.
    Faithless elector: an elector who votes contrary to their state’s popular result; rare, and now closely restricted by law.
    Check your understanding
    1. Using the table, explain why control of state legislatures matters to the presidential race even though state legislators are not on a presidential ballot.
    2. “The primaries and caucuses that decide each party’s nominee are constitutional requirements.” Explain why this statement is inaccurate.
    3. Suggest one reason why the 2026 midterm elections are being treated as significant for the 2028 presidential race, even though the presidency itself is not being contested.

    2. The Electoral College: mechanics and controversy

    The Electoral College was devised at the Constitutional Convention of 1787 as a compromise between direct popular election, distrusted by many delegates as vulnerable to demagogues, and selection by Congress, which risked making the president dependent on the legislature. Winning requires an absolute majority, 270 of the 538 votes, allocated to each state according to its total congressional delegation, so even the smallest states receive at least three. Forty eight states and Washington DC award all their electors to whichever candidate wins the state; Maine and Nebraska instead split most of their votes by congressional district, a method that gave Kamala Harris a single electoral vote from Nebraska’s 2nd district in 2024 even as she lost the state overall.

    Because electors are pledged rather than directly bound by the Constitution, faithless electors, who break from their state’s result, remain a theoretical possibility: seven did so in 2016, the most since 1972, though the underlying result was unaffected. The Supreme Court closed off much of this gap in Chiafalo v Washington (2020), ruling unanimously that states may legally require, and punish breaches of, elector pledges.

    The system has produced five elections in which the Electoral College outcome diverged from the national result: in 1876, 1888, 2000 and 2016 the College winner lost the national popular vote, and in 1824 no candidate secured a College majority at all, so the House of Representatives chose John Quincy Adams despite Andrew Jackson leading in both measures.

    In 2000, Bush v Gore ended a 36-day Florida recount battle by a final margin of just 537 votes, handing George W. Bush a 271 to 266 College win despite Al Gore’s half-million vote popular lead.

    In 2016, Donald Trump won the College while losing the popular vote to Hillary Clinton by almost three million votes. After Trump’s 2020 defeat, his campaign organised slates of 84 self-styled “alternate” electors across seven states who signed certificates falsely declaring he had won, a scheme that fed directly into the Capitol breach of 6 January 2021 and prompted the Electoral Count Reform Act of 2022, which clarified the vice president’s purely ceremonial role in certification. In 2024, by contrast, Trump won both the College, 312 to 226, and the popular vote, 49.8 per cent to 48.3 per cent, the first Republican to win the popular vote since 2004.

    StrengthWeakness
    Reflects the USA’s federal structure, guaranteeing every state a voiceSmall states are over-represented: a Wyoming voter’s weight is around 3.6 times a Californian’s
    Winner-take-all sustains a stable two-party systemThe same mechanism can turn a narrow win into a landslide, or hand the presidency to the popular-vote loser, as in 2000 and 2016
    Confines contested counts to a small number of close states, producing swift, decisive resultsConcentrates campaigning on a shrinking number of swing states, leaving most voters with limited influence
    No alternative has attracted the sustained, cross-party consensus needed to replace itThe National Popular Vote Interstate Compact holds 18 states and DC, 222 of the 270 votes needed, but reform has stalled largely along partisan lines

    Source: Gallup (September 2024); Pew Research Center (2024); Ballotpedia.

    • Public opinion has shifted since the 1968 near-consensus for change: a September 2024 Gallup poll found 58 per cent of Americans favoured electing the president by national popular vote against 38 per cent preferring the current system, with a Pew Research survey putting support for change at around 65 per cent, and the partisan gap now standing at roughly 80 per cent of Democrats against 46 per cent of Republicans.
    • Party self-interest tracks this divide closely: every state that has joined the National Popular Vote Interstate Compact has been Democratic-leaning, and in 2025 Maine’s Republican-controlled House voted 76 to 71 to withdraw from it, only for the Democratic-controlled Senate to block the repeal 18 to 16.

    Check your understanding
    1. Explain, using named examples, how the Electoral College’s winner-take-all method can produce a result different from the national popular vote.
    2. Using the evaluation table, assess whether the Electoral College still serves the purpose the Framers intended in 1787.
    3. Why might a state’s decision to join, or leave, the National Popular Vote Interstate Compact depend more on party advantage than constitutional principle?

    3. Money in American elections

    In 2003, the Supreme Court heard McConnell v Federal Election Commission, a challenge to the Bipartisan Campaign Reform Act (BCRA) of 2002. In upholding most of the Act, Justices Stevens and O’Connor observed that “money, like water, will always find an outlet”, a line that has come to summarise the whole history of American campaign finance: whenever the rules on political money have tightened, new channels have generally opened to let money flow by other means.

    Modern rules date from the Federal Election Campaign Act (FECA) of 1974, passed after Watergate, which introduced contribution limits, disclosure and voluntary public funding. Buckley v Valeo (1976) upheld those limits but struck down mandatory spending caps, establishing that spending on political speech is itself a form of protected speech.

    Presidential campaign spending has grown from $66.9 million in 1976 to $5.5 billion in 2024, with two turning points: candidates from 2000 onwards increasingly declined public funding, whose spending caps became a disadvantage once private fundraising could outstrip it, and Citizens United v FEC (2010), together with SpeechNow.org v FEC (2010), allowed unlimited independent spending and created the Super PAC. Barack Obama became the first major-party nominee to decline public funding for the general election in 2008; no nominee from either party has accepted it since.

    Key terms
    Hard money: donations raised and spent within federal contribution limits and disclosure rules; an individual may currently give up to $3,500 to a candidate’s campaign committee per election.
    Soft money: money raised and spent outside those limits for generic party-building activity, banned by BCRA in 2002.
    PAC (Political Action Committee): an organisation, often linked to a business or trade union, that pools donations to give directly to candidates, capped by law at $5,000 per candidate per election, a limit unchanged since 1974.
    Super PAC: an independent group that may raise and spend unlimited sums, provided it does not coordinate directly with a candidate’s campaign.
    Hybrid PAC: also called a Carey Committee, running two accounts side by side: one a capped PAC, the other an unlimited Super PAC.
    YearReform or rulingEffect
    1974Federal Election Campaign Act (FECA)Created the FEC; introduced contribution limits, disclosure and voluntary public funding
    1976Buckley v ValeoUpheld contribution limits and disclosure but struck down mandatory spending limits as a First Amendment violation
    2002Bipartisan Campaign Reform Act (BCRA)Banned national parties from raising soft money; upheld the following year in McConnell v Federal Election Commission
    2010Citizens United v FEC and SpeechNow.org v FECAllowed unlimited independent spending by corporations, unions and individuals, creating the Super PAC
    2014McCutcheon v FECStruck down the aggregate limit on how much a donor may give across all candidates and committees combined
    2014Congress ends convention public fundingLeft only unused primary matching funds and a general election grant no nominee has claimed since 2008
    2026NRSC v FECStruck down federal limits on party spending coordinated with its own candidates, overturning a 2001 precedent; decided 30 June 2026 by a 6–3 majority

    Source: FEC.gov, OpenSecrets, Ballotpedia, Brennan Center for Justice.

    • Each closed channel has reopened elsewhere: soft money after Buckley v Valeo, tax-exempt “527” groups after BCRA, such as Swift Boat Veterans for Truth, which raised over $25 million against John Kerry in 2004, and Super PACs and undisclosed “dark money” after Citizens United v FEC, and now unlimited coordinated party spending after NRSC v FEC.
    • In 2024, Future Forward, a hybrid PAC backing Kamala Harris, raised over $950 million, more than the combined cost of every presidential election held between 1976 and 1996, while Make America Great Again Inc., a Super PAC backing Donald Trump, raised $410.5 million; the businessman Elon Musk alone gave an estimated $277 million to Trump-aligned groups.
    • Money is not decisive on its own: Harris and allied groups raised roughly $2 billion in 2024 against about $1.45 billion supporting Trump, and still lost; Hillary Clinton outspent Trump in 2016 and lost too, suggesting money is closer to a necessary than a sufficient condition for a competitive campaign.

    Check your understanding
    1. Explain what the phrase “money, like water, will always find an outlet” means, using one example from the timeline.
    2. To what extent does the 2024 case study (Future Forward and Make America Great Again Inc.) suggest that the legal label attached to an outside spending group matters less than its scale?
    3. Using named examples, evaluate the claim that “US presidential elections are decided by whoever spends the most.”

    4. Incumbency: a significant but conditional advantage

    Incumbency advantage, the electoral benefit an officeholder derives simply from already holding office, rests on retrospective voting theory: the idea that voters judge an incumbent chiefly on the record of the preceding term, treating the election as a periodic referendum on the sitting administration rather than a forward-looking choice between programmes. Since George Washington established the norm of a voluntary two-term limit, 28 incumbents have stood for re-election; 18 won and 10 lost, a success rate of roughly two in three. Grover Cleveland remains the only president to lose a re-election bid, in 1888, and later regain the office, giving the United States its only non-consecutive presidency before Donald Trump’s return in 2025.

    AdvantageDisadvantage
    Name recognition and free media coverage: Obama’s official activities in 2012 routinely led the news, coverage Romney had to buyBlame for events beyond their control: Carter blamed for the Iran hostage crisis in 1980, Trump for Covid-19 and recession in 2020
    Easier fundraising and a united party, sparing a contested primary: Obama in 2012, Bush in 2004Heavy media scrutiny cuts both ways: Biden’s faltering 27 June 2024 debate crystallised doubts about his fitness and led to his withdrawal
    Executive experience and the rally round the flag effect: Bush’s 2004 campaign benefited from the residual effect of 11 SeptemberA fundraising advantage does not guarantee victory: Bush senior entered 1992 well-funded yet lost to Clinton amid recession
    Voter risk-aversion favours the known quantity: Reagan’s 1984 “Morning in America” campaignPrimary challenges can weaken a surviving incumbent: Ford in 1976 and Carter in 1980 both survived challenges, then lost in November

    Source: historical election results compiled from the National Archives and 270toWin.

    The advantage transfers poorly to same-party successors who have not themselves held the presidency, a quasi-incumbency problem visible across Richard Nixon in 1960, Hubert Humphrey in 1968, Al Gore in 2000, Hillary Clinton in 2016 and Kamala Harris in 2024, all of whom lost; the sole modern exception is George H. W. Bush’s 1988 victory. Harris entered the race as a quasi-incumbent after Joe Biden withdrew on 21 July 2024, running a compressed fifteen-week campaign that tried to combine continuity with the Biden administration and distance from its least popular positions, a balancing act several commentators judged incoherent; she lost all seven swing states and the popular vote.

    Term limits guarantee that, roughly every eight years, the presidency is contested as a genuinely open seat, as in 2000, 2008, 2016 and, in practical terms, 2024. Structural advantage is also no protection against a large enough shock: Hoover in 1932, Ford in 1976, Carter in 1980, Bush senior in 1992 and Trump in 2020 each lost despite the usual incumbency advantages, undone by depression, stagflation, recession or pandemic respectively. The six year itch, the tendency for a president’s party to suffer heavy congressional losses in the sixth year of a two-term presidency, as in 2014 and 2018, shows that incumbency at the top of the ticket offers little protection further down the ballot, a pattern the 2026 midterms will test again.

    Check your understanding
    1. Explain what is meant by “retrospective voting” and how it links to incumbency advantage.
    2. Using named examples, explain why incumbency advantage transfers poorly to a quasi-incumbent such as a sitting vice president.
    3. “Incumbency guarantees re-election.” Using the historical record (18 wins from 28 attempts), evaluate this claim.

    5. Bringing it together: 2020 and 2024

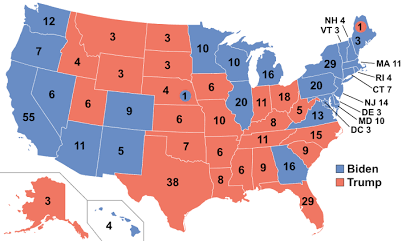
    The 2020 and 2024 cycles show every strand above operating together in a single contest. In 2020, Donald Trump was a true incumbent, benefiting from the fundraising and unified-party advantages incumbency usually confers, yet the rally round the flag effect conspicuously failed to appear amid the Covid-19 pandemic; Joe Biden won 306 electoral votes to Trump’s 232 and the popular vote by 51.3 per cent to 46.8 per cent, on turnout of around 66.6 per cent, the highest in over a century. Trump’s subsequent legal challenges and the fake electors scheme exposed real gaps in the certification process, later closed by the Electoral Count Reform Act of 2022, passed after the Capitol was breached on 6 January 2021.

    In 2024, incumbency worked differently again. Biden’s withdrawal left Harris as a quasi-incumbent, and despite Future Forward’s record-breaking operation on her behalf, she lost all seven swing states, becoming the third Democratic vice president in a row to fail in this position. Trump’s 312 to 226 College win, and his win of the popular vote for the first time by a Republican since 2004, meant the certification on 6 January 2025, with Harris herself presiding as vice president, passed off peacefully, a marked contrast with four years earlier.

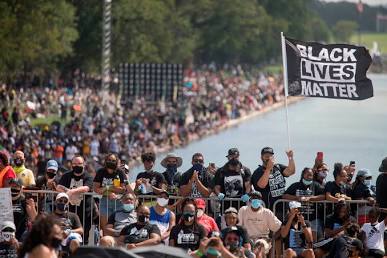
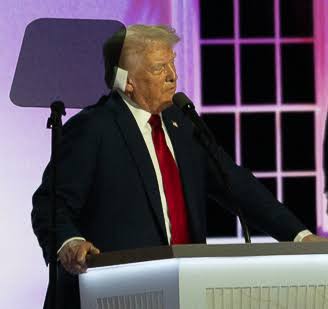
    • Both cycles were shaped by unexpected outside shocks: the pandemic and Black Lives Matter protests in 2020, an assassination attempt and a late candidate substitution in 2024.
    • Both raised serious questions about a candidate’s fitness for office: Trump’s conduct and legal jeopardy in 2020, Biden’s age and capacity in 2024.
    • The reforms passed after 2020, chiefly the Electoral Count Reform Act, appear so far to have held, though it remains an open question whether this reflects a genuine restoration of democratic norms or simply Trump’s 2024 victory removing his own incentive to contest the result.

    6. The Presidential Election system now: the 2028 cycle

    As of July 2026, the country sits at the very start of the 2028 cycle, in the invisible primary phase, around twenty seven months before polling day. On the Republican side, Vice President JD Vance remains the clear frontrunner in primary polling, at around 48 per cent among likely Republican primary voters in one recent survey, but Secretary of State Marco Rubio has recently overtaken him as favourite on prediction markets such as Kalshi, having trailed by around 25 points a year earlier, a reminder that an early polling lead is not the same as a settled nomination. On the Democratic side, no comparable frontrunner has emerged: Kamala Harris leads several polls of prospective primary voters, with Gavin Newsom, Alexandria Ocasio-Cortez and Pete Buttigieg all drawing measurable support.

    Trump himself remains constitutionally barred from a third term under the Twenty Second Amendment, notwithstanding his own repeated suggestions to the contrary, including musing about a “Trump 2028” cap and a mooted plan to run as vice president alongside Vance before assuming office again; Trump has himself acknowledged the text is “pretty clear” that he is “not allowed to run.” The 2026 midterm elections, contesting the full House, roughly a third of the Senate and numerous governorships, will offer the first real test of whether the six year itch reasserts itself against the Republican Party, and will shape the field considerably before any 2028 candidate formally declares.

    Evaluating the system as a whole

    Taken together, these five strands support a single, cautious conclusion: the American electoral system’s formal, constitutional architecture has changed remarkably little since 1787 and 1804, while the informal system built around it, party primaries, campaign money and the conventions of incumbency, has absorbed most of the pressure for change instead. The Electoral College has survived over two centuries of criticism and two elections this century in which it diverged from the popular vote, not because reformers lack a workable alternative, but because reform requires either a constitutional supermajority no Congress has assembled, or a state-by-state compact that has stalled at 222 of the 270 votes it needs, with party self-interest, visible even in Trump’s own reversal from “disaster” to “genius”, blocking further progress in either direction. Campaign finance shows the same pattern in a different register: fifty years of reform since FECA have repeatedly relabelled the channels through which political money flows, from soft money to 527 groups to Super PACs to, as of 30 June 2026, unlimited coordinated party spending under NRSC v FEC, without ever succeeding in reducing the total amount moving through them.

    Does Trump’s 2016 verdict still hold in 2026? On the Electoral College, the honest answer is that it has not yet been tested against him again: 2024 delivered him both the College and the popular vote together, so his “genius” verdict has not had to survive a second reversal of fortune, and there is little in the historical record, seven presidents have called the system a disaster only after losing under it, to suggest he would not flip back if 2028 or 2032 produced a College result at odds with the popular vote for a Republican candidate. On the money side, the picture is more clear-cut: the Stevens and O’Connor line has, if anything, been reinforced rather than tested since 2003, most recently by a Supreme Court that struck down one of the last remaining federal spending limits a month before this document was written. The water, in short, is still finding its outlet, and so, self-interest allowing, is Donald Trump’s own judgement of the rules that govern it.

    Check your understanding
    1. Using evidence from at least two sections of this document, assess how far Donald Trump’s changing verdicts on the Electoral College illustrate a wider pattern in this topic.
    2. “The US electoral system is essentially unreformable.” Evaluate this claim, drawing on both the Electoral College and campaign finance sections.
    3. Looking ahead to 2028, explain which of the concepts covered in this document, incumbency, quasi-incumbency, the invisible primary, or campaign finance, you consider most likely to shape the outcome, and why.

    A fuller comparison with the UK’s capped, disclosed system of party funding and its first-past-the-post electoral system is developed elsewhere on histpology.co.uk.

    Sources

    Primary sources

    U.S. Constitution, Article II and Amendments XII, XX, XXII and XXV  https://constitution.congress.gov/constitution/

    3 U.S. Code § 15, Counting electoral votes in Congress (Cornell LII)  https://www.law.cornell.edu/uscode/text/3/15

    Chiafalo v Washington, 591 U.S. ___ (2020)  https://supreme.justia.com/cases/federal/us/591/19-465/

    Bush v Gore, 531 U.S. 98 (2000)  https://supreme.justia.com/cases/federal/us/531/98/

    Buckley v Valeo, 424 U.S. 1 (1976)  https://supreme.justia.com/cases/federal/us/424/1/

    McConnell v Federal Election Commission, 540 U.S. 93 (2003)  https://supreme.justia.com/cases/federal/us/540/93/

    Citizens United v FEC, 558 U.S. 310 (2010)  https://supreme.justia.com/cases/federal/us/558/310/

    SpeechNow.org v FEC, 599 F.3d 686 (D.C. Cir. 2010)  https://www.fec.gov/legal-resources/court-cases/speechnoworg-v-fec/

    McCutcheon v FEC, 572 U.S. 185 (2014)  https://supreme.justia.com/cases/federal/us/572/185/

    Carey v FEC, 791 F. Supp. 2d 121 (D.D.C. 2011)  https://www.courtlistener.com/opinion/2146537/carey-v-federal-election-comn/

    NRSC v FEC, 609 U.S. ___ (2026)  https://www.fec.gov/updates/supreme-court-finds-limits-on-coordinated-party-expenditures-unconstitutional-in-nrsc-v-fec-609-us-____2026/

    Secondary sources

    Federal Election Commission, campaign finance statistics and historical reports  https://www.fec.gov/data/

    OpenSecrets, “Cost of Election”  https://www.opensecrets.org/elections-overview/cost-of-election

    OpenSecrets, “Dark Money Basics”  https://www.opensecrets.org/dark-money/basics

    Ballotpedia, Federal Election Campaign Act (FECA), legislative history  https://ballotpedia.org/Federal_Election_Campaign_Act

    Congress.gov, legislative history of the DISCLOSE Act, the For the People Act and the Freedom to Vote Act  https://www.congress.gov/

    Brennan Center for Justice, research and analysis on campaign finance and FEC enforcement  https://www.brennancenter.org/issues/reform-money-politics

    Bipartisan Policy Center, “Trends in Campaign Financing, 1980–2016”, Zachary Albert  https://bipartisanpolicy.org/wp-content/uploads/2019/05/Trends-in-Campaign-Financing-1980-2016.-Zachary-Albert..pdf

    National Archives, U.S. Electoral College results by year  https://www.archives.gov/electoral-college

    270toWin, presidential election results by year  https://www.270towin.com/

    Pew Research Center, “Behind Biden’s 2020 Victory”  https://www.pewresearch.org/politics/2021/06/30/behind-bidens-2020-victory/

    Pew Research Center, “Voter turnout in the 2020 and 2024 elections”  https://www.pewresearch.org/politics/2025/06/26/voter-turnout-2020-2024/

    Gallup, “Americans Still Favor Replacing Electoral College System”, September 2024  https://news.gallup.com/poll/651353/americans-favor-replacing-electoral-college-system.aspx

    Wikipedia, “2020 United States presidential election”  https://en.wikipedia.org/wiki/2020_United_States_presidential_election

    Wikipedia, “2024 United States presidential election”  https://en.wikipedia.org/wiki/2024_United_States_presidential_election

    Protect Democracy, “Understanding the Electoral Count Reform Act of 2022”  https://protectdemocracy.org/work/understanding-the-electoral-count-reform-act-of-2022/

    V. O. Key Jr, The Responsible Electorate: Rationality in Presidential Voting, 1936 to 1960 (1966)

    Douglas A. Hibbs, ‘Bread and Peace Voting in US Presidential Elections’, Public Choice (2000)  https://link.springer.com/article/10.1023/A:1005292312412

    Ray C. Fair, Predicting Presidential Elections and Other Things (Stanford University Press)  https://fairmodel.econ.yale.edu/index1.htm

    Newsweek and Zogby Analytics, polling on 2028 presidential contenders, July 2026  https://www.newsweek.com/jd-vance-aoc-gavin-newsom-2028-poll-12194158

    CNBC, “Rubio odds for GOP 2028 nominee close to overtaking Vance on Kalshi”, June 2026  https://www.cnbc.com/2026/06/01/rubio-odds-for-gop-2028-nominee-close-to-overtaking-vance-on-kalshi.html

    Federal News Network, “Checking in on Presidential Election Odds for 2028”, July 2026  https://federalnewsnetwork.com/prediction-markets/2026/07/checking-presidential-election-odds-2028/

  • US Presidential Election Campaign Finance


    “Money, like water, will always find an outlet”

    In 2003, the Supreme Court heard the case of McConnell v Federal Election Commission, a challenge to the Bipartisan Campaign Reform Act (BCRA) of 2002, a law that had tightened the rules on political donations and campaign advertising. In the joint opinion of Justices John Paul Stevens and Sandra Day O’Connor, upholding most of the Act, the Court observed:

    “Money, like water, will always find an outlet.”

    This single line has become one of the most quoted phrases in the study of American campaign finance (the raising and spending of money to fight elections). It captures a pattern that runs through the whole history of the subject: whenever the federal government has tightened the rules on political money, whether after the Watergate scandal of the 1970s, after the BCRA of 2002, or after later Supreme Court rulings, new channels have generally opened up to let money flow into politics by other means. The tables below set out the scale of this money, where it has come from, and what it has been spent on.

    The rising cost of running for president

    Modern rules on presidential campaign finance date from the Federal Election Campaign Act (FECA) of 1974, passed in the wake of Watergate (in which illegal corporate donations to Richard Nixon’s campaign played a central part). FECA introduced limits on contributions, required public disclosure of donations, and created a system of public funding for candidates who agreed to spending limits in return. Since then, the cost of presidential elections has grown enormously, particularly after the Supreme Court’s ruling in Citizens United v FEC (2010), which allowed corporations, trade unions and wealthy individuals to spend unlimited sums independently of a candidate. Note that figures before 2008 mostly cover candidates’ own spending under the old public funding limits, while figures from 2008 onwards include the much larger sums spent independently by parties and outside groups, so the two periods are not directly comparable. None of the figures below are adjusted for inflation (the general rise in prices over time).

    Election yearApproximate total spendingContext
    1976$66.9 millionFirst election held under FECA 1974. Gerald Ford and Jimmy Carter were the first nominees to run under the new system, each accepting a $21.8 million general election grant instead of raising money privately
    1980$92.3 millionRonald Reagan defeated Jimmy Carter; independent candidate John Anderson later qualified for a retroactive public grant of over $4 million after winning more than 5% of the vote
    1984$103.6 millionReagan’s landslide re-election victory over Walter Mondale; both campaigns operated under the public funding system’s spending limits
    1988$210.7 millionSharp rise driven partly by television advertising, including the notorious “Willie Horton” attack adverts targeting Michael Dukakis, funded not by the Bush campaign itself but by an independent group, the National Security PAC
    1992$192.2 millionIndependent candidate Ross Perot spent an estimated $65 million of his own fortune challenging George H. W. Bush and Bill Clinton
    1996$239.9 millionBill Clinton and Bob Dole both accepted public funding for the general election; Ross Perot, running again for the Reform Party, qualified for a $29 million public grant based on his strong 1992 showing
    2000$343.1 millionGeorge W. Bush became the first modern candidate to decline primary matching funds, freeing his campaign from the spending limits attached to them
    2004$1.02 billionFirst presidential contest to pass $1 billion, and the last covered mainly by candidate committees, party conventions and public funds; Democrats Howard Dean and John Kerry joined Bush in turning down public funding so as to avoid its spending limits
    2008$2.4 billionFigures from this point onwards include parties and outside spending alongside candidates. Barack Obama declined public funding for the general election; John McCain accepted the grant, worth around $84 million, becoming the last major-party nominee to do so
    2012$2.6 billionFirst election after Citizens United v FEC (2010); rapid growth of Super PACs, including Restore Our Future backing Mitt Romney and Priorities USA Action backing Obama
    2016$2.4 billionDonald Trump put around $66 million of his own money into his primary campaign against Hillary Clinton, before relying more heavily on donor funding in the general election
    2020$5.7 billionThe most expensive presidential race to that point, driven by record small-donor fundraising through platforms such as ActBlue and WinRed, alongside record outside spending
    2024$5.5 billionKamala Harris’s campaign raised over $1 billion within about three months of entering the race after Joe Biden withdrew in July 2024, the fastest any presidential campaign has reached that total

    Figures are approximate and drawn from Federal Election Commission (FEC) and OpenSecrets data; see sources below.

    The pattern in the table is hard to miss, and comes down to a small number of turning points:

    • Spending crept upwards gradually across the last quarter of the twentieth century, staying under $350 million as late as 2000.
    • It then leapt after 2000, once leading candidates began turning down public funding altogether: public money came with strict spending caps attached, so a candidate confident of raising more privately had every incentive to opt out.
    • Barack Obama took this furthest in 2008, becoming the first major-party nominee to decline public funding for the general election itself; no nominee from either major party has accepted it since.
    • The Supreme Court’s ruling in Citizens United v FEC pushed the total higher still from 2012 onwards, by allowing Super PACs to raise and spend without limit alongside the official campaigns.

    Check your understanding

    1. Using the table, explain why the figures for total spending look so different before and after 2008.
    2. Identify two named candidates from the table who financed part of their own campaign from personal wealth.
    3. “The public funding system created in 1974 has essentially collapsed.” Find one piece of evidence in the table that supports this claim, and one detail that complicates it.

    Where does the money come from?

    Presidential campaigns are funded from a mixture of sources, and the balance between them has shifted considerably since the 1970s, particularly away from public funding and towards outside spending by independent groups.

    SourceWhat it meansNotes
    Small individual donorsOrdinary supporters giving modest sums, often online (typically under $200 in total)Barack Obama’s 2008 campaign pioneered large-scale online small-donor fundraising; Bernie Sanders’s 2016 and 2020 campaigns built on this, reporting an average donation of around $27
    Large individual donorsWealthier individuals giving close to the legal maximum permitted per candidateRemains the largest source of money given directly to candidates themselves, for example an individual giving the current maximum of $3,500 to Donald Trump’s or Kamala Harris’s 2024 campaign committee
    Political Action Committees (PACs)Organisations, often linked to businesses, trade unions or interest groups, that pool members’ donations to give to candidatesContributions are capped by federal law at $5,000 per candidate per election, for example from a corporate PAC or a trade union PAC such as the AFL-CIO’s
    Super PACs and other outside groupsIndependent groups that may raise and spend unlimited sums on adverts and campaigning, provided they do not coordinate directly with a candidateMade possible by the Citizens United v FEC and SpeechNow.org v FEC rulings of 2010; in 2024, Future Forward (backing Kamala Harris) and Make America Great Again Inc. (backing Donald Trump) each spent hundreds of millions of dollars independently
    Party committeesNational and state party organisations, such as the Democratic National Committee and Republican National CommitteeFund both direct spending and spending coordinated with a candidate, such as each committee’s support for its own presidential ticket
    Public fundingMatching funds for primary candidates and grants for the general election, financed by a voluntary checkbox on federal tax returnsEffectively abandoned by major-party candidates since 2008; John McCain remains the last nominee to accept a general election grant, worth around $84 million
    Candidate self-fundingMoney that candidates give to their own campaigns from personal wealthNotable examples include Ross Perot (1992), Donald Trump, who put around $66 million into his 2016 primary campaign, and Michael Bloomberg (2020)

    Figures and definitions drawn from OpenSecrets and FEC guidance; see sources below.

    Two trends sit side by side here, pulling in opposite directions:

    • Online fundraising has made small donations far more significant than they were even a decade ago, letting candidates such as Bernie Sanders and Barack Obama build large war chests from millions of modest contributions.
    • At the same time, an ever smaller number of extremely wealthy donors have gained outsized influence through Super PACs. In the 2024 election, for example, the businessman Elon Musk alone gave an estimated $277 million to Donald Trump and allied Republican groups, more than the entire cost of some full presidential elections in the 1980s.
    • Public funding, the system Congress built after Watergate to prevent exactly this kind of dependence on wealthy backers, has been left far behind by both trends.

    Check your understanding
    1. In your own words, explain the difference between hard money and soft money.
    2. Explain how a Super PAC is legally different from a Political Action Committee (PAC).
    3. Why might a candidate end up more dependent on a single Super PAC than on thousands of small donors, even if the small donors give more money in total?

    What is the money spent on?

    Campaigns divide their spending across several broad categories, although candidates are not required to report disbursements in a single standard format, so exact national totals for each category are difficult to establish precisely.

    Category of spendingWhat it coversNotes
    Advertising (television, radio and digital)Adverts bought to reach voters through broadcast media, streaming services and online platformsUsually the single largest category of spending in a modern presidential campaign
    Staff and consultantsSalaries and fees for campaign managers, communications teams, strategists and pollsters 
    Field operationsCanvassing, phone banks and data operations used to identify and turn out supporters on election dayOften referred to informally as the “ground game” or get-out-the-vote (GOTV) effort
    Polling and researchSurveys and opposition research used to guide campaign strategy and messaging 
    Fundraising costsExpenses involved in raising money itself, such as events, direct mail and digital fundraising platforms 
    Administration and overheadsOffice costs, travel, technology and legal or compliance costs, including ensuring the campaign follows Federal Election Commission (FEC) rules 

    Categories are illustrative and based on standard accounts of how presidential campaigns allocate spending; see sources below.

    Whatever its source, most of this money ends up being spent on reaching voters rather than on running the campaign itself:

    • Television advertising has traditionally taken the largest single share of campaign spending.
    • Digital advertising has narrowed the gap considerably since the 2010s, as campaigns have followed voters onto social media and streaming platforms.
    • Behind the adverts sits a much larger, less visible operation: hundreds of paid staff, pollsters and local organisers, whose task is to turn persuasion on a screen into votes cast on election day.

    Taken together, the three tables above help to explain why the Stevens and O’Connor line has proved so durable:

    • Each attempt to close off a route for political money (the FECA limits of 1974, the BCRA restrictions of 2002) has, sooner or later, been followed by the opening of a new one, whether that is the abandonment of public funding or the rise of the Super PAC.
    • It is this recurring pattern of regulation and circumvention (finding a legal way around a rule) that we turn to next, alongside the legislation and court rulings that have shaped it.

    Check your understanding
    1. List three categories of campaign spending, giving one concrete example of each.
    2. Explain why “regulation and circumvention” is a useful phrase for summarising the history of US campaign finance so far.

    Analysing and evaluating campaign finance reform, 1974 to the present

    The problem set out by Justices Stevens and O’Connor is, at heart, a clash between two goals that the American constitutional system has never fully reconciled. The first is the wish to limit the corrupting influence, or the appearance of corrupting influence, that large sums of money can have over elected officials, the concern that drove Congress to act after the Watergate scandal. The second is the First Amendment’s protection of free political speech, which the courts have repeatedly interpreted as covering not just what a candidate or donor says, but how much they are permitted to spend saying it. Reformers have spent fifty years trying to restrict the first without falling foul of the second, and, as the timeline below shows, each new rule has tended to produce a new way around it. Four terms recur throughout this story:

    Key terms

    Hard money: donations that are raised and spent within the contribution limits and disclosure rules set out in federal election law. For example, an individual may currently give up to $3,500 to a presidential candidate’s official campaign committee per election (so $7,000 across the primary and general election combined), a limit the FEC adjusts periodically for inflation.

    Soft money: money that was raised and spent outside these federal limits, typically donated to a political party for generic “party-building” activity, such as voter registration drives or general advertising, rather than to a named candidate. For example, before this practice was banned by BCRA in 2002, a corporation could give an unlimited sum directly to a national party committee.

    Political Action Committees (PACs): organisations, often linked to a business, trade union or interest group, that pool contributions from their members in order to donate directly to candidates. Contributions from PACs to a candidate remain capped by federal law, currently at $5,000 per candidate per election, a limit that has not risen since 1974.

    Super PACs: independent expenditure-only committees that may raise and spend unlimited sums from individuals, corporations and trade unions, provided they do not coordinate directly with a candidate’s campaign. For example, groups such as Priorities USA Action and Make America Great Again Inc. have each spent tens of millions of dollars independently supporting their preferred presidential candidate, with no legal ceiling on the total.
    YearReform attemptWhat it didOutcome
    1974Federal Election Campaign Act (FECA) AmendmentsCreated the FEC (Federal Election Commission); introduced contribution limits, spending limits and disclosure rules; set up voluntary public funding for primaries, conventions and the general electionPassed directly in response to the Watergate scandal; key parts struck down two years later
    1976Buckley v Valeo (Supreme Court)Upheld contribution limits, disclosure and voluntary public funding, but struck down mandatory spending limits and limits on independent expenditure and candidates’ self-fundingEstablished that spending money on political speech is itself a form of speech, protected by the First Amendment
    1979Further FECA amendments and FEC rulingsSimplified disclosure requirements; allowed parties to raise unlimited “soft money” for generic party-building activitySoft money grew from about $19 million in 1980 to roughly $487 million by 2000
    2002Bipartisan Campaign Reform Act (BCRA, “McCain-Feingold”)Banned national parties from raising or spending soft money; restricted corporate and trade union funding of “electioneering communications” shortly before an electionUpheld, in large part, the following year
    2003McConnell v Federal Election Commission (Supreme Court)Upheld BCRA’s soft money ban and its restriction on electioneering communicationsSource of the “money, like water” quotation; later substantially overturned
    2004Rise of 527 groupsNominally independent, tax-exempt groups such as Swift Boat Veterans for Truth raised large sums by avoiding explicit “vote for” or “vote against” languageSwift Boat Veterans alone raised over $25 million to campaign against Senator John Kerry
    2010Citizens United v FEC (Supreme Court)Ruled that corporations and trade unions may spend unlimited sums independently of a candidate, as a form of protected political speechOverturned the electioneering communications restriction upheld in McConnell
    2010SpeechNow.org v FEC (Court of Appeals, DC Circuit)Struck down limits on contributions to groups that only make independent expendituresCreated the Super PAC, alongside Citizens United
    2010 and 2012DISCLOSE Act (proposed)Would have required disclosure of large donors funding independent political advertsBlocked twice by Senate filibuster (59–41 in 2010; 51–44 in 2012)
    2014McCutcheon v FEC (Supreme Court)Struck down the aggregate limit on the total amount an individual could give across all candidates and committees combinedLimits on how much a donor may give to any single candidate remained in place
    2014Congress ends convention public fundingRedirected the public money previously used to fund party nominating conventions towards paediatric medical researchLeft only primary matching funds and the general election grant, both largely unused by then
    2019 and 2021For the People Act (H.R.1)Would have created a voluntary small-donor matching system and stronger donor disclosure rulesPassed the House of Representatives twice; failed a Senate cloture vote 50–50 in 2021
    2021Freedom to Vote ActA narrower bill including donor disclosure rules and public financing for House of Representatives campaignsFailed a Senate procedural vote, 49–51
    1996 onwardsState and city-level alternatives (Maine, Arizona, New York City, New York State)“Clean Elections” and small-donor matching schemes provide full or matching public funding outside the federal systemShow that reform remains possible below the federal level, even where federal reform has stalled
    2026NRSC v FEC (Supreme Court)Struck down federal limits on how much a political party may spend in coordination with its own candidates, overturning FEC v Colorado Republican Federal Campaign Committee (2001)Decided 30 June 2026; parties may now spend without limit alongside their candidates, though limits on contributions to parties themselves remain in place

    Dates, case citations and figures drawn from Ballotpedia, Justia, Oyez, FEC.gov, the Brennan Center for Justice, OpenSecrets and Congress.gov; see sources below.

    Check your understanding
    1. Explain the significance of Buckley v Valeo for later attempts to regulate campaign spending.
    2. Choose one reform from the timeline and explain how it was later undermined or worked around.
    3. Why has the Federal Election Commission (FEC) struggled to enforce campaign finance law effectively?

    Case study: PACs, Super PACs and hybrid PACs in recent presidential elections

    The Key terms box above defines Political Action Committees (PACs), Super PACs and, implicitly, a third and less familiar vehicle: the hybrid PAC, also called a Carey Committee after the 2011 court case that created it (Carey v FEC). A hybrid PAC runs two separate bank accounts side by side, one that behaves exactly like a connected PAC, giving limited sums directly to a candidate, and one that behaves exactly like a Super PAC, raising and spending without limit provided it stays independent of the campaign. Comparing all three side by side, across three different presidential elections, shows how far outside spending has grown since Citizens United v FEC and how little the precise legal label now seems to matter:

    TypeLegal positionExample (presidential election)Scale
    Connected PACMay give directly to a candidate’s campaign, but capped at $5,000 per candidate per election, a limit that has not risen since 1974A corporate or trade union PAC giving the maximum $5,000 to a presidential candidate’s campaign committeeIndividually small; there are thousands of registered PACs, but none may give a candidate more than the cap
    Super PACMay raise and spend unlimited sums, but only independently of a candidate, with no direct contributions and no coordinationRestore Our Future (pro-Romney) and Priorities USA Action (pro-Obama), 2012Restore Our Future spent $142.1 million; Priorities USA Action spent $65.2 million
    Super PACAs aboveMake America Great Again Inc. (pro-Trump), 2024Raised $410.5 million and spent around $376.9 million, including $251.7 million opposing Kamala Harris directly
    Hybrid PAC (Carey Committee)Runs two separate bank accounts: one operating as a capped connected PAC, the other as an unlimited Super PACFuture Forward (pro-Harris), 2024Raised over $950 million and spent around $517 million on the presidential race, the largest single-candidate outside group in US history

    Figures drawn from FEC filings as reported by OpenSecrets, the Brennan Center for Justice and Ballotpedia; see sources below.

    Three points stand out from this comparison:

    • The gap between a connected PAC and the other two vehicles has widened enormously since 1974: a connected PAC’s $5,000 cap has not moved in fifty years, while Super PACs and hybrid PACs now each raise and spend hundreds of millions of dollars per election.
    • The legal distinction between a Super PAC and a hybrid PAC made little practical difference to the scale of spending in 2024: Make America Great Again Inc. (a pure Super PAC) and Future Forward (a hybrid PAC) both ran operations costing several hundred million dollars, each dominant on its side of the race.
    • Both leading 2024 campaigns became dependent on a single outside group of this kind, funded in turn by a small number of very large donors, such as Timothy Mellon’s $150 million gift to Make America Great Again Inc., which is itself the pattern that concerned Congress when it first legislated in 1974.

    Check your understanding
    1. Explain the difference between a Super PAC and a hybrid PAC.
    2. Using the case study, assess how far the legal distinction between different types of outside group actually limits the amount of money reaching a presidential election.

    Judged against its own original aims, this history supports two quite different conclusions, and A-level students are expected to weigh both rather than simply pick one:

    Reform has largely failed to control money in politics

    • Each rule has closed one channel only for the money to reopen another: soft money after Buckley v Valeo, 527 groups after BCRA, and Super PACs and “dark money” (political spending whose ultimate donor is not disclosed) after Citizens United and SpeechNow.org.
    • The public funding system Congress designed in 1974, meant to reduce candidates’ dependence on private donors, has been turned down by every major-party nominee since 2008, and Congress itself ended convention funding altogether in 2014.
    • The FEC, the very body created in 1974 to enforce these rules, is a six-member commission split evenly between the two parties and needs four votes to act; researchers have found that around 40 per cent of its enforcement votes deadlocked between 2017 and 2020.
    • More recent attempts at reform, including the DISCLOSE Act and the For the People Act, have repeatedly failed to pass Congress, generally along party lines.

    The system may be working broadly as the Constitution requires

    • Since Buckley v Valeo (1976), the Supreme Court has consistently treated spending on political speech, though not direct contributions, as protected by the First Amendment, on the grounds that limiting how much a person or group may spend restricts their ability to communicate a political message.
    • Direct contribution limits, which the Court views as posing the clearest risk of corruption, remain in place and have not been struck down by any of the rulings above.
    • Disclosure requirements, upheld in both Buckley v Valeo and Citizens United v FEC, mean that most political spending, dark money being the significant exception, is publicly recorded.
    • On this reading, the answer to persistent loopholes is not more restriction, which the courts are likely to strike down again, but better disclosure, so that voters can judge the influence of money for themselves.

    On balance, the case study above tips the argument towards the first interpretation. Future Forward alone raised over $950 million in 2024, more than the combined cost of every presidential election held between 1976 and 1996. This suggests that the precise legal label attached to a channel for political money, hard money, soft money, a connected PAC, a Super PAC or a hybrid PAC, matters less in practice than the underlying principle established in Buckley v Valeo: that spending money on political speech is constitutionally protected, and is therefore extremely difficult to cap. Fifty years of reform have repeatedly succeeded in relabelling the channels through which political money flows, and in forcing more of it into the open through disclosure, but they have not yet succeeded in reducing the total amount flowing through them.

    The internet and campaign finance

    The internet has changed campaign finance in two directions at once. On one hand, it has widened participation by letting candidates raise very large sums directly from ordinary supporters, bypassing the traditional PAC and major-donor networks described above. On the other, it has opened a new and less regulated channel for exactly the kind of undisclosed spending that reformers have tried to close off since 1974.

    • Online fundraising platforms now handle small-dollar giving at a scale unimaginable a generation ago. In the 2024 cycle, the Democratic platform ActBlue processed around $3.8 billion in donations, and the Republican equivalent, WinRed, around $1.7 billion, figures that dwarf the entire cost of any presidential election held before the 2000s. This pattern was pioneered by Barack Obama’s 2008 campaign and taken furthest by Bernie Sanders in 2016 and 2020, whose average donation was reported at $27.
    • Small-dollar fundraising is not evenly spread through a campaign, however: it tends to cluster around short, highly publicised moments. Kamala Harris’s campaign, for example, raised nearly $50 million within seven hours of her 2024 launch, largely through ActBlue. This suggests the internet has changed the timing and visibility of giving as much as who gives.
    • Digital advertising has also grown into a major and less transparent category of spending. Political advertisers spent an estimated $1.9 billion on online adverts across the major platforms during the 2024 cycle, and digital advertising can be microtargeted (tailored to narrow audiences using personal data) in a way that television advertising, still subject to long-standing federal disclosure rules, cannot.
    • Because online political advertising is not subject to the same disclosure rules as broadcast television, it has become a growing route for dark money. In the 2024 cycle, groups that do not disclose their donors spent more than $281 million on online adverts without reporting that spending to the FEC at all.

    Taken together, this suggests the internet has not resolved the tension between free political speech and the risk of corruption that runs through this whole topic; it has simply moved a growing share of both small-dollar democracy and undisclosed dark money onto a platform that 1970s-era campaign finance law was never designed to regulate.

    Check your understanding
    1. Explain how online platforms such as ActBlue and WinRed have changed the way presidential campaigns raise money.
    2. To what extent has the internet made political spending in the USA more transparent, or less?

    Conclusion: money, water and 2026

    Does money still find a way through in 2026? On 30 June 2026, the Supreme Court answered this question again, in real time. In NRSC v FEC, the Court struck down the federal limit on how much a political party may spend in coordination with its own candidates, overturning FEC v Colorado Republican Federal Campaign Committee (2001), a limit Congress had relied on for a quarter of a century. Coordinated party spending had been one of the last channels still subject to a meaningful federal cap; it no longer is. The chronology in this document can therefore be read, quite literally, up to the week in which it was written: the pattern Stevens and O’Connor described in 2003 has continued for more than twenty years since, and was still operating a month before this document was completed.

    Is it fair to say that, by 2026, it is essentially all soft money? Not literally. Soft money, in the strict sense, means unlimited donations to a political party for generic party-building activity, and that specific practice has remained banned since BCRA in 2002; the NRSC ruling did not touch it, nor did it alter the separate limits on how much an individual or PAC may give to a party or a candidate directly. But functionally, the description is not far off. The practical effect Congress was trying to prevent in 1974, large sums of money reaching a campaign with no meaningful cap, has re-emerged through a sequence of legally distinct routes: soft money itself, then 527 groups, then Super PACs and hybrid PACs, then dark money, and now unlimited coordinated party spending. None of these is technically “soft money”, yet each has served the same function. The proportion of election money moving through the strictly capped, disclosed “hard money” channel has fallen steadily since 2002, even as the banned label itself has stayed banned.

    Are US presidential elections decided simply by whoever spends the most? The evidence is mixed, and this is exactly the kind of claim a good exam answer should be cautious about accepting at face value:

    • Barack Obama outspent both John McCain (2008) and Mitt Romney (2012), and won both elections, a pattern often cited as evidence that money buys victory.
    • Yet Hillary Clinton outspent Donald Trump in 2016 and lost; Michael Bloomberg spent over $1 billion of his own money seeking the 2020 Democratic nomination and won only American Samoa.
    • Most strikingly, in 2024 Kamala Harris and her allied groups raised and spent around $2 billion in total, compared with around $1.45 billion supporting Donald Trump, and Trump won.
    • Political scientists generally treat the relationship as correlation rather than simple cause and effect: strong, already-popular candidates tend to attract the most donations, meaning donors are often picking likely winners rather than creating them, and beyond a basic competitive threshold, additional spending appears to bring diminishing returns.

    On the evidence gathered in this document, money looks close to a necessary condition for a competitive presidential campaign, a candidate with too little of it cannot get a message seen at all, but it is not a sufficient one. It cannot buy a popular message, a disciplined campaign or a favourable political climate, and it has not, in half a century of trying, been brought under lasting control. The water, in short, is still finding its outlet.

    “Money, like water, will always find an outlet.”

    Check your understanding
    1. “US presidential elections are decided by whoever spends the most.” Evaluate this view, using at least two named examples from this document.
    2. Explain what is meant by describing US campaign finance reform as a game of “regulatory whack-a-mole”.
    3. Why might voters, courts and legislators disagree about whether the current system is a success or a failure?

    This clash between free political speech and the control of money in elections is one of the sharpest contrasts between the US and UK approaches to politics; it is picked up directly, and set alongside the UK’s capped, disclosed system of party funding, elsewhere on histpology.co.uk.


    Sources

    Federal Election Commission, campaign finance statistics and historical reports (fec.gov)

    OpenSecrets, “Cost of Election”, “Presidential Elections” and “Dark Money Basics” (opensecrets.org)

    McConnell v Federal Election Commission, 540 U.S. 93 (2003)

    Buckley v Valeo, 424 U.S. 1 (1976); Citizens United v FEC, 558 U.S. 310 (2010); SpeechNow.org v FEC, 599 F.3d 686 (D.C. Cir. 2010); McCutcheon v FEC, 572 U.S. 185 (2014); Carey v FEC, 791 F. Supp. 2d 121 (D.D.C. 2011); NRSC v FEC, 609 U.S. ___ (2026)

    Federal Election Commission, “Supreme Court finds limits on coordinated party expenditures unconstitutional in NRSC v FEC”, FEC Record, 1 July 2026 (fec.gov)

    OpenSecrets, PAC profiles for Restore Our Future, Priorities USA Action, Make America Great Again Inc. and Future Forward (opensecrets.org)

    OpenSecrets, “2024 in review: total outside fundraising for presidential candidates”, February 2025 (opensecrets.org)

    Bipartisan Policy Center, “Trends in Campaign Financing, 1980–2016” (bipartisanpolicy.org)

    Brennan Center for Justice, research and analysis on campaign finance and FEC enforcement (brennancenter.org)

    Ballotpedia and Congress.gov, legislative history of FECA, the DISCLOSE Act, the For the People Act and the Freedom to Vote Act


  • Incumbency in US Presidential Elections


    KEY TERM Incumbency: the fact of currently holding a political office; in this context, being the sitting president, or the sitting vice president standing to succeed them, at the time of an election.

    Defining Incumbency and Its Advantage

    • Incumbency advantage refers to the electoral benefit an officeholder (in this case, the President) derives simply from already holding office, independent of the underlying popularity of their party or policies.
    • In the American context it is most commonly discussed in relation to Congress, where re-election rates regularly exceed ninety per cent, a topic covered in more detail in a separate page on congressional elections.
    • It operates differently, and far less reliably, at the presidential level, where only one individual holds the office and every re-election campaign is fought under intense national scrutiny.
    • The theory behind incumbency is retrospective voting, the idea that the electorate evaluates an incumbent chiefly by judging the record of the preceding term rather than by comparing detailed policy platforms.
    • On this view, elections function as a periodic referendum on the performance of the sitting administration, particularly its management of the economy, rather than a forward-looking choice between programmes.

    Advantages and Disadvantages of Incumbency

    AdvantagesDisadvantages
    Name recognition and media attention: voters already know the incumbent, who also commands routine media coverage simply by carrying out the duties of office, while a challenger must work hard merely to be noticed. Example: Obama’s official activities as president routinely led the nightly news throughout 2012, coverage Romney could only match by paying for advertising.

    Fundraising: sitting presidents typically raise money more easily than challengers, drawing on an established donor network and the fundraising pull of the office itself. Example: incumbents from Nixon onward have generally out-raised their challengers, though, as the disadvantages column shows, this has not always been enough to win.

    Lack of a primary challenge: an incumbent seeking a second term is very rarely challenged seriously within their own party, sparing them the cost and division of a contested primary that most challengers must survive first. Example: both Obama in 2012 and Bush in 2004 proceeded directly to the general election without a meaningful primary contest.

    Single candidacy: because the incumbent party unites early behind one figure, it enters the general election with its resources and organisation intact, while the opposing party’s field can fragment support and money across several rivals. Example: in 2012, Romney emerged from a long, multi-candidate Republican primary against Gingrich, Santorum and Paul bruised and short of funds, while Obama faced no equivalent contest.

    Executive position: control and experience: incumbents can use the formal powers of office, executive orders, pardons, foreign policy announcements and the timing of favourable economic data, to shape the campaign, and bring direct experience of governing that no challenger can match. Example: George W. Bush’s 2004 re-election campaign was built substantially around his conduct of the war on terror as commander-in-chief.

    Experience of the campaign: an incumbent’s operation has typically already fought one national campaign, giving it a tested staff, fundraising machinery and voter data that a first-time challenger must build from scratch. Example: Obama’s 2012 campaign built directly on the organisational and data infrastructure developed for his 2008 run.

    Risk aversion: voters often prefer the known quantity of an incumbent to the uncertainty of change, particularly where no acute crisis demands it. Example: Reagan’s 1984 ‘Morning in America’ campaign leaned explicitly into continuity and stability after the recovery from recession.

    The rally round the flag effect: international crises or military action can produce a short-term surge in an incumbent’s approval ratings, as the public initially unites behind the government. Example: George W. Bush’s re-election prospects in 2004 benefited from the residual rally effect of the 11 September attacks and the war on terror.
    Blame for things that go wrong: incumbents carry direct responsibility for events during their term, even those substantially outside their control, and can be punished disproportionately at the ballot box. Example: Jimmy Carter was blamed for stagflation and the Iran hostage crisis in 1980, and Donald Trump was blamed for the Covid-19 pandemic and the recession that followed it in 2020, despite neither having caused the underlying shock.

    Media exposure cuts both ways: the same heavy coverage that raises an incumbent’s profile also gives challengers, and unscripted moments, a national stage on which to damage them. Example: Joe Biden’s faltering performance in the televised debate of 27 June 2024, watched by tens of millions, crystallised doubts about his fitness and led directly to his withdrawal from the race three weeks later.

    Money does not guarantee success: a fundraising advantage does not automatically convert into votes once conditions turn against an incumbent’s record. Example: George H. W. Bush entered 1992 with a substantial financial and organisational advantage yet still lost to Bill Clinton amid recession and voter anger over a broken promise not to raise taxes.

    Primary challenges can still be damaging: even where an incumbent survives a primary challenge rather than losing it, the contest can leave the party divided and the incumbent weakened for the general election. Example: Gerald Ford only narrowly saw off Ronald Reagan’s challenge for the Republican nomination in 1976, and Jimmy Carter survived a bruising challenge from Ted Kennedy in 1980; both incumbents went on to lose in November.

    The Historical Record

    • Since George Washington established the norm of a voluntary two-term limit, twenty-eight incumbents have stood for re-election.
    • Eighteen won and ten lost, a success rate of roughly two in three, though the pattern is far from evenly spread across history.
    • Grover Cleveland is the sole president to lose a re-election bid, in 1888, and later regain the office four years afterwards, giving the United States its only non-consecutive presidency prior to Donald Trump’s return in 2025.

    The table below sets out every contested incumbent re-election bid of the twentieth and twenty-first centuries.

    YearIncumbentOutcomeElectoral votePopular vote
    1912William Howard Taft (R)Lost8 to 43523.2% (three-way split with Roosevelt and Wilson)
    1916Woodrow Wilson (D)Won277 to 25449.2% to 46.1%
    1932Herbert Hoover (R)Lost59 to 47239.7% to 57.4%
    1936Franklin D. Roosevelt (D)Won523 to 860.8% to 36.5%
    1940Franklin D. Roosevelt (D)Won449 to 8254.7% to 44.8%
    1944Franklin D. Roosevelt (D)Won432 to 9953.4% to 45.9%
    1948Harry Truman (D)Won303 to 18949.6% to 45.1%
    1956Dwight Eisenhower (R)Won457 to 7357.4% to 42.0%
    1972Richard Nixon (R)Won520 to 1760.7% to 37.5%
    1976Gerald Ford (R)*Lost240 to 29748.0% to 50.1%
    1980Jimmy Carter (D)Lost49 to 48941.0% to 50.7%
    1984Ronald Reagan (R)Won525 to 1358.8% to 40.6%
    1992George H. W. Bush (R)Lost168 to 37037.4% to 43.0%
    1996Bill Clinton (D)Won379 to 15949.2% to 40.7%
    2004George W. Bush (R)Won286 to 25150.7% to 48.3%
    2012Barack Obama (D)Won332 to 20651.1% to 47.2%
    2020Donald Trump (R)Lost232 to 30646.8% to 51.3%
    2024Kamala Harris (D)†Lost226 to 31248.3% to 49.8%

    * Ford had succeeded to the presidency under the Twenty Fifth Amendment following Nixon’s resignation and had never himself been elected president or vice president; he is nonetheless conventionally treated as an incumbent seeking re-election.  † Harris was the sitting vice president and the Democratic nominee following Joe Biden’s withdrawal on 21 July 2024; she had not herself held the presidency, making 2024 a case of quasi-incumbency rather than a true incumbent re-election bid.


    Case Studies in Success

    • 1984: Ronald Reagan’s landslide, winning forty nine of fifty states on the back of a strong economic recovery from the 1981 to 1982 recession, remains the largest electoral college victory in modern history.
    • 1996: Bill Clinton was re-elected comfortably amid sustained economic growth and low unemployment, defeating a Republican challenger, Bob Dole, widely seen as failing to offer a compelling alternative.
    • 2004: George W. Bush won narrowly, converting the residual rally effect from the 11 September attacks and the broader war on terror into re-election, defeating John Kerry by 286 electoral votes to 251.
    • 2012: Barack Obama secured a second term despite a slow recovery from the 2008 financial crisis, benefiting from a divided and underfunded Republican challenge from Mitt Romney.

    Case Studies in Failure

    • 1932: Herbert Hoover was overwhelmed by the Great Depression, losing 41 of 48 states to Franklin Roosevelt as unemployment approached twenty five per cent.
    • 1976: Gerald Ford never escaped the legacy of his pardon of Richard Nixon, combined with stagflation (high inflation paired with a stagnant, slow-growing economy) and a weak recovery, losing narrowly to Jimmy Carter.
    • 1980: Jimmy Carter was defeated by Ronald Reagan amid continuing stagflation, a sustained energy crisis and the unresolved Iran hostage crisis, which entered its 444th day on the very day of Reagan’s inauguration.
    • 1992: George H. W. Bush, despite record approval ratings after the 1991 Gulf War, lost to Bill Clinton after a recession and a broken 1988 promise not to raise taxes, with Ross Perot’s independent candidacy taking 18.9 per cent of the popular vote, the largest third-party share since 1912.
    • 2020: Donald Trump lost to Joe Biden amid the Covid-19 pandemic and the associated economic contraction; the rally round the flag effect that has historically attached to incumbents during a national crisis conspicuously failed to appear.

    The Quasi-Incumbency Problem: 2024

    • Joe Biden withdrew from the race on 21 July 2024 after a widely criticised debate performance had crystallised doubts about his age and fitness.
    • He endorsed his vice president, Kamala Harris, who inherited the nomination without a contested primary.
    • Harris therefore entered the general election as the sitting vice president of an unpopular administration, without having herself been the incumbent president, and without the benefit of a full term in which to build an independent record.
    • Her campaign attempted to run simultaneously on continuity, emphasising achievements of the Biden administration, and change, distancing herself from its least popular positions on inflation and immigration, a balancing act that several commentators judged incoherent.
    • Harris was in an almost impossible position: voters had shown themselves willing to punish the governing party for perceived poor performance on the cost of living, even though the candidate on the ballot was not the official who had presided over it.

    The light of America’s promise will always burn bright, as long as we never give up, and as long as we keep fighting.

    Kamala Harris, concession speech, Howard University, 6 November 2024

    • Harris lost all seven swing states and the national popular vote.
    • She became the third Democratic vice president in a row, after Walter Mondale in 1984 and Al Gore in 2000, to fail in an attempt to succeed a two-term president of their own party.
    • The single exception in the modern era is George H. W. Bush’s victory in 1988, still the only time a sitting vice president has been elected directly to succeed the president he served under since Martin Van Buren in 1836.

    Term Limits and the Absence of Incumbency

    • The Twenty Second Amendment, ratified in 1951 after Franklin Roosevelt’s unprecedented four elections, restricts a president to two elected terms.
    • Its effect is to guarantee that, roughly every eight years, the presidency is contested as a genuinely open seat with no incumbent on the ballot at all, as occurred in 2000, 2008 and 2016, and, in practical terms, again in 2024 once Biden withdrew.
    • Open-seat contests remove the direct incumbency effect but not necessarily its indirect, party-level equivalent, since the sitting party’s nominee is frequently judged by the same retrospective standard as a true incumbent would be, as the 2000, 2016 and 2024 cases illustrate.
    • Donald Trump’s own repeated ‘threats’ about a third term, including a mooted plan to run as vice president alongside JD Vance before later becoming president again, has been widely read as recognising, however implausibly given the constitutional bar, the scale of the advantage incumbency is thought to confer.

    Evaluating Its Significance Today

    • As an explanatory and predictive factor, incumbency remains central to the leading quantitative forecasting models of American presidential elections, both of which treat it as a foundation variable rather than a marginal adjustment.
    • The advantage is neither uniform nor guaranteed. Increased partisan polarisation has shrunk the pool of persuadable swing voters since the 1990s, meaning fewer voters remain available to be moved by retrospective performance judgements regardless of how well or badly an incumbent has governed.
    • The six year itch, the historical tendency for a president’s party to suffer heavy congressional losses in the sixth year of a two-term presidency, shows that incumbency at the top of the ticket offers little protection to the president’s own party further down the ballot, as the 2014 and 2018 midterms both demonstrated.
    • Shocks beyond a president’s control, such as a pandemic, a recession or a foreign policy crisis, can overwhelm whatever structural advantage incumbency would otherwise supply, as 1932, 1980, 1992 and 2020 each show.
    • Quasi-incumbents, vice presidents or same-party successors who inherit the burdens of an administration’s record without ever having exercised its full powers themselves, appear to fare especially poorly, a pattern visible across Nixon in 1960, Humphrey in 1968, Gore in 2000, Clinton in 2016 and Harris in 2024.

    Contemporary Example: The 2028 Cycle

    • As of July 2026, the country is in the invisible primary phase of the 2028 cycle.
    • Vice President JD Vance is widely regarded as the Republican front runner, occupying a position similar to the status held by Bush in 1988, Gore in 2000 and Harris in 2024, though how that status will translate into votes remains untested.
    • Trump himself is constitutionally barred from a third term under the Twenty Second Amendment, despite his own repeated suggestions to the contrary, guaranteeing a genuinely open Republican contest for the presidency itself even as Vance seeks to inherit its incumbency-linked advantages.
    • No comparable front runner has emerged on the Democratic side.
    • The 2026 midterm elections will offer an early practical test of whether the six year itch pattern reasserts itself against the Republican Party in Congress, even though the presidency will not itself be on the ballot until 2028.

    Conclusion

    • Incumbency is among the most consistent single predictors of outcomes in American presidential elections.
    • Yet its record is markedly uneven: it has rewarded presidents who preside over peace and prosperity, Reagan, Clinton, Bush in 2004 and Obama among them, while offering little protection against depression, stagflation, recession or pandemic, as Hoover, Ford, Carter, Bush senior and Trump each discovered.
    • Its benefits, moreover, transfer poorly to same-party successors who have not themselves held the presidency, a pattern that both the historical record and the unsuccessful vice-presidential candidacies of Nixon, Humphrey, Gore, Clinton and Harris illustrate consistently.
    • Incumbency, in short, is a significant but conditional advantage, decisive when conditions favour the sitting administration and largely inert, or even counterproductive, when they do not.

  • The Electoral College in the USA


    Constitutional Origins

    The electoral college was devised at the Constitutional Convention of 1787 as a compromise between two rejected alternatives: direct popular election, distrusted by many delegates as vulnerable to ‘demagogues’, and selection of the president by Congress, which risked making the executive dependent on the legislature.

    Under Article II, each state was given a number of electors equal to its total congressional delegation, a formula that also meant the Three-Fifths Compromise over enslaved populations directly inflated the political weight of slaveholding states in presidential elections, as well as in the House.


    How the Electoral College Works

    The mechanics of the system are set out in Article II of the Constitution, as modified by the Twelfth Amendment of 1804, which required separate ballots for president and vice-president after a tied election in 1800, and by the Electoral Count Reform Act of 2022:


    Rogue and Faithless Electors

    Because electors are chosen by party rather than directly elected as free agents, they are expected, and in most states legally required, to vote for the candidate to whom they are pledged.

    Electors who break this pledge are known as faithless electors. They are rare and have never changed the outcome of an election, but they do expose a genuine gap between the Constitution’s original design, in which electors were meant to exercise independent judgement, and the party-controlled system that operates today.

    • 2016: seven electors broke their pledges when the college met, the most since 1972, two defecting from Donald Trump and five from Hillary Clinton, though the underlying result, Trump 304 to Clinton 227, was unaffected.
    • Chiafalo v Washington (2020): the Supreme Court unanimously held that states may legally require, and punish breaches of, elector pledges, closing off any prospect that electors could act as genuinely free agents in the way the Framers originally envisaged.

    Contested and Disputed Elections

    Because the college translates state-level results into a single national outcome, close or disputed state counts have twice in recent decades produced serious constitutional and political crises.

    • 2000, Bush v Gore: after a 36-day recount battle in Florida, the Supreme Court halted a manual recount, handing George W. Bush the state’s 25 electoral votes by a final margin of just 537 votes out of nearly six million cast, and with it a 271 to 266 electoral college victory, despite Al Gore winning the national popular vote by more than half a million ballots.
    • 2020 to 2021, the fake electors scheme: after Trump’s defeat, his campaign organised slates of 84 self-styled “alternate” electors across seven contested states, who signed certificates falsely declaring that Trump had won, in the hope that Vice President Mike Pence would count them instead of the certified results when Congress met to certify the outcome on 6 January 2021. Fake electors and allied organisers in Arizona, Georgia, Michigan, Nevada and Wisconsin were later criminally charged, although a Michigan court subsequently dismissed the case against 15 defendants for insufficient evidence.

    “Let there be no doubt, while I strongly disagree with the court’s decision, I accept it.”

    Al Gore, concession address, 13 December 2000


    Contemporary Example: 2024

    Trump won decisively in 2024, 312 electoral votes to Kamala Harris’s 226, becoming the first Republican candidate in twenty years also to win the national popular vote, with 77.3 million votes, 49.8 per cent, against Harris’s 75.0 million, 48.3 per cent, a margin of 1.5 percentage points.

    Maine and Nebraska, which have allocated most of their electoral votes by congressional district since 1972 and 1992 respectively, both split their votes again: Harris won the electoral vote attached to Nebraska’s 2nd congressional district even while losing the state overall, only the third such split since Nebraska adopted the method.


    Evaluating Its Significance Today

    Attitudes to the electoral college often track self-interest as much as principle, illustrated neatly by Donald Trump’s own reversal after losing, then winning, under it:

    “The electoral college is a disaster for a democracy.”

    Donald Trump, tweet, 6 November 2012, the day after Barack Obama’s re-election

    “The Electoral College is actually genius in that it brings all states, including the smaller ones, into play. Campaigning is much different!”

    Donald Trump, tweet, 15 November 2016, after his own election


    Strengths
    StrengthExplanation
    Reflects the federal nature of the USAGuarantees every state, however small, a minimum voice (at least 3 electoral votes) in choosing the president, consistent with a constitutional structure built around states as well as citizens, rather than a single undifferentiated national electorate.
    Tends to promote a two-horse raceWinner-take-all allocation in 48 states makes it very difficult for a third-party or independent candidate to win any electoral votes at all, which helps sustain the stable two-party competition that has characterised US politics since the mid-19th century, and arguably avoids the fragmented, multi-party coalition-bargaining seen under some proportional systems.
    Builds broad geographic coalitionsCandidates must campaign across many different states and regions to assemble an electoral college majority, rather than simply maximising turnout in the largest cities.
    Produces decisive, quickly known resultsConfines contested counts to a small number of close states rather than triggering a nationwide recount, as a single national popular vote tally conceivably could.
    No clearly better alternative has emergedReform proposals such as direct national election, or the National Popular Vote Interstate Compact, would require a constitutional amendment or a fragile inter-state agreement, and critics argue they carry their own risks, such as nationwide recount disputes; despite decades of criticism, no alternative has attracted the sustained, cross-party consensus needed to replace the current system.

    “I venture somewhat further, and hesitate not to affirm, that if the manner of it be not perfect, it is at least excellent.”

    Alexander Hamilton, Federalist No. 68, 1788


    Weaknesses
    WeaknessExplanation
    Small states are over-representedA Wyoming voter’s electoral weight is around 3.6 times that of a Californian, since Wyoming’s roughly 194,000 people per elector compares with California’s roughly 700,000, sitting uneasily beside the “one person, one vote” principle applied elsewhere in American electoral law.
    Winner-take-all can distort the resultBecause all of a state’s electoral votes go to whichever candidate wins its popular vote, narrow national margins can look like landslides: Ronald Reagan won 50.7 per cent of the popular vote in 1980 but 489 of 538 electoral votes, 90.9 per cent. The same mechanism can also work in reverse, handing the presidency to the popular vote loser, as it did in 2000 and 2016.
    Unfair to national third partiesA candidate can win a substantial share of the national vote yet no electoral votes at all if that support is spread thinly across states rather than concentrated: independent candidate Ross Perot won 18.9 per cent of the popular vote in 1992, almost 19.7 million votes, but zero electoral votes, having failed to finish first in any single state.
    Rogue or faithless electorsElectors are not directly bound by the Constitution to vote for their pledged candidate. Although Chiafalo v Washington (2020) confirmed that states may legally require and enforce pledges, seven electors still broke ranks in 2016 alone, exposing a structural gap between the Framers’ original design and how the system operates in practice.
    Risk of a president and vice-president from different partiesBecause a contingent election has the House choose the president and the Senate separately choose the vice-president, it remains constitutionally possible for the two chambers, especially if controlled by different parties, to elect a president and vice-president from opposing tickets. This is not merely theoretical: under the pre-1804 system, the Federalist John Adams became president in 1796 while his defeated rival, the Democratic-Republican Thomas Jefferson, became vice-president as runner-up, an arrangement the Twelfth Amendment only partially closed off.
    Concentrates campaigning on a shrinking number of swing statesLeaves voters in the large majority of “safe” states, of either party, with limited practical influence on the outcome, a criticism that continues to drive reform proposals such as the National Popular Vote Interstate Compact, enacted by 18 states and Washington DC holding 222 electoral votes as of 2026, 48 short of the 270 needed to take effect.

    Possible Reforms

    Dissatisfaction with the electoral college has produced several distinct reform proposals, differing sharply in how they would work and in how much constitutional and political difficulty they would face.

    Reform proposalHow it would work
    National Popular Vote Interstate CompactMember states legally pledge to award all their electors to whichever candidate wins the most votes nationwide, once enough states have joined to control a 270-vote majority between them. It requires no constitutional amendment, since states retain full authority over how their own electors are chosen, and the existing state-run election machinery, registration, voting and counting, is otherwise left untouched.
    Constitutional amendment for direct electionWould abolish the electoral college outright: the candidate with the most votes nationwide wins, with no intervening electors or state-level allocation at all, and no single national body currently exists to administer or recount such a vote. Almost all such proposals specify a simple plurality rather than a guaranteed majority, so a president could in principle be elected with well under half the national vote. It requires approval by two-thirds of both houses of Congress and ratification by three-quarters, 38, of the states, the highest bar of any reform on this list.
    Congressional district method nationwideExtends the system already used in Maine and Nebraska to every state: two electoral votes go to the statewide winner and one to the winner of each congressional district. This is a state-level choice, achievable through ordinary state legislation.
    Proportional allocation within statesEach state would divide its electoral votes between candidates in proportion to their share of that state’s popular vote, rather than winner-take-all, again achievable through ordinary state legislation.
    • Impact on 2000 and 2016: either direct election or NPVIC would have changed the outcome in 2000, handing the presidency to Al Gore, who led the national popular vote by over half a million ballots, and in 2016, handing it to Hillary Clinton, who led by almost 2.9 million.
    • Impact on 2020 and 2024: neither reform would have made any difference, since Joe Biden and Donald Trump respectively won both the popular vote and the electoral college in those years.
    • Impact of the congressional district method: this does not reliably track the national popular vote, since its outcome depends on how districts happen to be drawn. Applied nationwide in 2012, Mitt Romney would have won the presidency despite Barack Obama winning the national popular vote by around 5 million ballots, largely because Republican-drawn districts following the 2010 census were skewed in the GOP’s favour. Applied to 2020, Biden would still have won, but by a much narrower margin of around 277 to 261 rather than his actual 306 to 232.
    • Impact of proportional allocation: would generally produce results closer to the national popular vote than winner-take-all, but by splitting electoral votes so widely it could, in principle, leave no candidate with the 270 votes needed for a majority even in an otherwise clear-cut election, throwing a contingent election to the House of Representatives far more often than the current system does.
    • Public opinion: a Gallup poll from September 2024 found 58 per cent of Americans in favour of amending the Constitution to elect the president by national popular vote, against 38 per cent preferring the current system; a Pew Research survey from the same period put support for change at around 65 per cent. This is a recent shift: a 1968 Gallup poll found 66 per cent in favour with almost no partisan gap, whereas today around 80 per cent of Democrats support change against roughly 46 per cent of Republicans.
    • Party behaviour: every state that has joined the National Popular Vote Interstate Compact backed the Democratic candidate in 2016, and every governor who signed compact legislation has been a Democrat. In 2025, Maine’s Republican-controlled House voted 76 to 71 to withdraw from the compact, only for the Democratic-controlled Senate to block the repeal 18 to 16; Colorado Republicans have separately, and so far unsuccessfully, pushed to repeal that state’s membership.

    • Why the parties differ: the current system has delivered the presidency to the Republican candidate twice since 2000, in 2000 and 2016, despite a national popular vote loss both times, giving Republicans a structural reason to defend the status quo and Democrats a matching reason to seek change.
    • Likelihood, constitutional amendment: exceptionally unlikely, since the partisan divide makes both the two-thirds congressional supermajority and the 38-state ratification threshold very difficult to reach.
    • Likelihood, NPVIC: more attainable in principle, needing no supermajority, but stalled at 18 states and Washington DC holding 222 of the 270 electoral votes required, with growth confined to Democratic-leaning states and the narrowly defeated Maine repeal effort of 2025 showing membership cannot be taken for granted.

    • Likelihood, district and proportional methods: achievable through ordinary state legislation alone, but state parties have little incentive to unilaterally give up a system that currently favours them, so comprehensive reform of the electoral college looks unlikely in the near future despite real public support for change.

    Judgement

    The electoral college has drifted a long way from Hamilton’s vision of independent, deliberating electors: it now operates as an automatic, state-by-state counting mechanism for pledged slates, with faithless electors an increasingly closed-off possibility since Chiafalo.

    Whether it still deserves its place is a live and consequential debate rather than a settled question.

    To its defenders, it reflects the federal structure of the union, helps sustain a stable two-party system and has generally produced quickly accepted outcomes, with no clearly better alternative yet commanding broad consensus.

    To its critics, it over-represents small states, can distort or reverse the popular verdict, denies representation to national third parties in proportion to their support, and, through the contingent election procedure, still leaves open the theoretical possibility of a president and vice-president from opposing parties, as briefly occurred in 1796.

    Reform proposals exist and command real public support, but the partisan self-interest that currently divides opinion on them, visible even in Trump’s own reversal from “disaster” to “genius”, makes near-term change unlikely, and the answer to whether reform should happen at all likely turns as much on how far Americans still value state-level federalism against national democratic equality as it does on the mechanics of counting votes.


  • National Nominating Conventions in the USA


    Origins and Historical Development

    National nominating conventions emerged in the 1830s as a replacement for the discredited congressional caucus system, known pejoratively as “King Caucus”, whereby party members of Congress had quietly chosen presidential candidates among themselves.

    The Anti-Masonic Party held the first national convention in 1831; the Democrats followed in 1832, nominating Andrew Jackson for a second term, and the Republicans held their first convention in 1856, nominating John C. Frémont.

    For over a century, conventions were genuine deliberative bodies rather than ceremonial ones.

    Delegates often arrived uncommitted or only loosely committed, and the nominee was decided through bargaining, factional deals and, at times, dozens of ballots on the convention floor.

    • 1924 (Democrats): the convention required 103 ballots to nominate John W. Davis, the longest deadlock in the party’s history.
    • 1932 (Democrats): Franklin D. Roosevelt secured the nomination only after the party’s “two thirds rule”, requiring a supermajority of delegates, was satisfied through intense backroom negotiation.
    • 1952 and 1976 (Republicans): among the last conventions with genuine first-ballot uncertainty, the latter seeing Gerald Ford narrowly hold off a challenge from Ronald Reagan.

    “The convention is the voice, the bone and the sinews of a political party, and sometimes it even nominates an Abraham Lincoln.”
    Fletcher Knebel, American journalist and novelist

    Convention rhetoric could itself become historic. Franklin D. Roosevelt’s acceptance address to the 1932 Democratic convention gave the New Deal its name:

    “I pledge you, I pledge myself, to a new deal for the American people.”
    Franklin D. Roosevelt, 1932 Democratic National Convention


    The Shift from Decision-Making to Ratification

    The turning point was the 1968 Democratic National Convention in Chicago.

    Hubert Humphrey secured the nomination without having won a single primary, while violent clashes between police and anti-Vietnam War protesters outside the hall exposed, live on national television, the gap between party elites and ordinary voters.

    This prompted the McGovern-Fraser Commission reforms of 1968 to 1972, which bound delegate selection much more closely to the outcome of primaries and caucuses.

    The consequences of this shift can be summarised as follows:

    • By the late 1970s, the outcome of the nomination was almost always settled by primaries and caucuses months before delegates gathered.
    • The Democratic Party: following recommendations from the 1982 Hunt Commission, the party first used superdelegates at its 1984 convention to preserve some elite influence, then curtailed their first-ballot voting power in 2018 following controversy over the 2016 Clinton and Sanders contest.
    • Conventions became increasingly televised, stage-managed events built around prime-time speeches and coordinated messaging rather than genuine deliberation.

    “After four years at the United Nations I sometimes yearn for the peace and tranquillity of a political convention.”
    Adlai E. Stevenson, reflecting on his time as US Ambassador to the United Nations

    The 2020 conventions of both parties were held largely virtually because of the Covid-19 pandemic, demonstrating that even the physical assembly of delegates was no longer functionally necessary to the nomination itself.


    Embarrassing and Chaotic Moments

    The same televised immediacy that exposed the divisions of 1968 has continued to generate unscripted, occasionally excruciating moments across the decades since.

    Because conventions combine live television, large crowds and minimal script control, they have produced some of American politics’ most revealing episodes, affecting both parties rather than one.

    Far from undermining their value as a subject of study, these moments often expose the underlying tensions within a party more candidly than the official programme intends.

    • 1972 (Democrats): poor scheduling meant that George McGovern delivered his acceptance speech at 2.48am, by which point most of the American television audience had gone to bed.
    • 1980 (Democrats): after a bitter primary battle, Jimmy Carter and Ted Kennedy shared a visibly awkward, fleeting handshake on stage, widely read at the time as proof the party remained divided.
    • 2012 (Republicans), Tampa: actor Clint Eastwood delivered a rambling, unscripted address to an empty chair, into which he improvised responses on behalf of an imaginary President Obama. The stunt spawned the internet meme “Eastwooding” and was widely judged to have distracted from Mitt Romney’s message on the eve of his own acceptance speech.
    • 2016 (Republicans), Cleveland: Melania Trump’s speech was found to contain passages closely resembling Michelle Obama’s 2008 convention address, prompting a plagiarism row that overshadowed the opening night. Two days later, Ted Cruz was booed off the stage after refusing to endorse Donald Trump, telling delegates instead to “vote your conscience”.
    • 2016 (Democrats), Philadelphia: unresolved bitterness from the primaries surfaced when significant numbers of Bernie Sanders’ own delegates booed him for urging them to support Hillary Clinton. Barack Obama was later moved to appeal for unity directly from the podium:

    “Don’t boo. Vote.”
    Barack Obama, 2016 Democratic National Convention, Philadelphia


    Contemporary Examples: 2024

    The 2024 cycle, arriving amid unusually compressed circumstances of its own, illustrates how thoroughly ceremonial conventions have become, while also showing they retain real political value.

    • Republican National Convention, Milwaukee, July 2024: confirmed Donald Trump’s nomination, a foregone conclusion after he had already defeated Nikki Haley in the primaries, and unveiled JD Vance as his running mate. The convention’s most striking moment, Trump appearing days after surviving an assassination attempt, had nothing to do with the formal nominating function and everything to do with the media spectacle. His acceptance speech, at just under ninety-three minutes the longest in modern convention history, opened with a direct reference to the shooting:

    “I am not supposed to be here tonight. I stand before you in this arena only by the grace of Almighty God.”
    Donald Trump, 2024 Republican National Convention acceptance speech, Milwaukee

    • Democratic National Convention, Chicago, August 2024: nominated Kamala Harris, but the decisive step, replacing Joe Biden as the party’s candidate after his withdrawal in July 2024, was effectively settled beforehand through a virtual delegate roll call, not on the convention floor itself. The convention functioned chiefly as a rallying and unification exercise for a switch that had already occurred.

    Evaluating Their Significance Today

    The case that conventions remain important
    • They retain a formal function, certifying the nominee and running mate, even where the substantive decision was made earlier.
    • They provide a rare period of sustained, uninterrupted national media coverage, framed entirely on the party’s own terms.
    • They serve a unifying function, visible in the speed with which Democrats coalesced around Harris in 2024, and can launch national careers, as Barack Obama’s 2004 keynote famously did.
    • They can still mark genuine historical moments: Harris’s nomination in 2024 followed Hillary Clinton’s in 2016 as only the second time a major party had nominated a woman for president.

    “There’s not a liberal America and a conservative America; there’s the United States of America.”
    Barack Obama, 2004 Democratic National Convention keynote address

    “When they go low, we go high.”
    Michelle Obama, 2016 Democratic National Convention

    The case that their significance has declined
    • The outcome is settled by primaries and caucuses months in advance; no convention since 1976 has involved genuine first-ballot uncertainty.
    • The so-called “convention bounce” in opinion polls, once a reliable and sizeable effect, has shrunk considerably in an era of deep partisan polarisation and pre-existing voter loyalty.
    • Running mates and campaign themes are now frequently announced or trailed before the convention even begins, reducing its function as a moment of genuine disclosure.
    • Television audiences have fallen sharply compared with the network-era peak, and the decline has continued into the most recent cycles:
    • 1952: the first convention with “gavel to gavel” coverage was carried on 104 stations in 68 cities, reaching an estimated 70 million viewers out of a total US population of only around 158 million.
    • 1980s: as ratings and advertising revenue fell, the major networks abandoned full coverage; by 1988 they had cut their nightly broadcasts to around two hours, leaving gavel-to-gavel coverage to the newly launched C-SPAN.
    • 1984 to 2004: convention ratings fell by around 30 per cent compared with the previous twenty years, as cable channels offered rival programming.
    • 2016: opening night of the Republican convention drew around 23 million viewers.
    • 2024: opening night of the Republican convention drew around 18 million viewers, and the Democratic convention’s opening night drew around 20 million, a fall of roughly 22 per cent on its 2016 equivalent, despite a US population of over 335 million.

    “We didn’t discover our values in a poll taken a week before the convention.”
    Ronald Reagan, 1984 Republican National Convention acceptance speech, Dallas


    Judgement

    Conventions are no longer a key part of the nomination process: that decision now rests with voters in primaries and caucuses, and the convention merely ratifies it.

    However, they remain a meaningful part of the wider electoral process, functioning as a nationally televised rally that unifies the party, sets the tone for the general election campaign and can still produce historically significant, and occasionally excruciating, moments.

    The fairest assessment is that conventions have been transformed rather than rendered obsolete: from decision-making bodies into carefully choreographed campaign launches, still useful to parties but no longer essential to how the nominee is actually chosen.


  • The Primary System in United States Elections


    1. Introduction

    The presidential nomination process in the United States relies on primary elections and caucuses, with no direct equivalent in parliamentary systems such as the United Kingdom. Rather than a party leader being chosen by parliamentarians or members, the two main parties invite millions of voters, over several months, to choose who contests the general election. The system is decentralised, varies by state, and is shaped as much by party practice as by statute.

    This page covers:

    • the main types of primary contest and the invisible primary that precedes them;
    • how the Republican Party and Democratic Party apply these mechanisms differently;
    • the system’s strengths and weaknesses; and
    • the debate over its reform.

    2. The Mechanics of the System: Types of Contest and the Invisible Primary

    The term “primary” covers several distinct mechanisms, each shaping who participates and whose preferences count.

    Closed, open and semi-closed primaries

    The key variable is who may vote:

    • Closed primaries: only voters registered with a party may vote in its contest, ensuring the nominee reflects the party’s own supporters but excluding registered independents.
    • Open primaries: any registered voter may vote in either contest, maximising turnout but risking “raiding“, where rival supporters back the weaker opposing candidate.
    • Semi-closed primaries: unaffiliated voters may choose a party ballot; registered rivals remain barred.

    Rules are set by states and parties, so practice varies widely, as the table below shows.

    TypeWho may voteIllustrative states (2024–26)
    ClosedOnly voters registered with that partyFlorida, New York, Pennsylvania, Kentucky
    Semi-closedParty registrants, plus unaffiliated voters who may choose a party ballotNew Hampshire; New Mexico from 2026
    OpenAny registered voter, regardless of party registrationWisconsin, South Carolina, Georgia
    Caucuses versus primaries

    A primary is a government-run ballot election; a caucus is a party-run meeting, often decided by a public vote rather than a secret ballot.

    • Caucuses demand more time from participants, producing lower turnout and a less representative electorate.
    • The 2020 Iowa Democratic caucuses were undermined by a failed reporting app, delaying results for several days.
    • Most states, including Nevada, have since switched to primaries.
    The invisible primary

    Before voting begins, candidates compete in the invisible primary, the period, often over a year, before Iowa and New Hampshire vote. Coined by journalist Arthur Hadley, the term describes “unnoticed manoeuvring” to secure victory before voters are involved.

    • Candidates compete for media coverage, elite endorsements and donor money (the “money primary“).
    • Strong early fundraising and polling attract more of the same, making the process self-reinforcing.
    • A candidate’s standing at its end closely predicts eventual nomination success, giving donors and party elites outsized early influence.

    Party Practice: How the Republican and Democratic Parties Use Primaries Differently

    Both parties use primaries and caucuses to allocate convention delegates, but under different rules that interact with political circumstance to produce very different contests.

    Delegate allocation rules

    The two parties diverge sharply:

    • Republican rules: states voting before 15 March must allocate delegates proportionally, up to a 20% threshold; after that date, states may use winner-take-all allocation.
    • Democratic rules: proportional allocation applies throughout, with a 15% threshold, keeping contests competitive for longer.
    • Superdelegates: unpledged Democratic delegates could once back any candidate; after criticism over the 2016 contest, the party barred them from voting on a first ballot from 2018.
    The 2024 Republican contest

    The 2024 Republican primary shows how the invisible primary and early sequencing can compress a wide field quickly:

    • Ron DeSantis entered in mid-2023 as Donald Trump’s main rival but trailed throughout.
    • After Trump’s Iowa caucus win in January 2024, DeSantis withdrew, leaving Nikki Haley as the sole challenger.
    • Trump beat Haley in New Hampshire; after she won only one of fifteen Super Tuesday contests, she withdrew.
    • Trump became presumptive nominee by 12 March 2024, months before the convention.
    The 2024 Democratic contest and the nomination of Kamala Harris

    The 2024 Democratic contest took an unusual path:

    • Joe Biden won over 3,800 of the 1,976 delegates needed before withdrawing on 21 July 2024 amid concerns over his age and electability.
    • Because he withdrew after the primaries had ended, delegates became unbound and chose the nominee themselves.
    • Over 99% backed Kamala Harris, confirmed by voice vote at the Chicago convention on 5 August 2024, without her contesting a single primary.

    Millions had voted, yet the nominee was ultimately chosen by delegates rather than primary voters, a reminder of the primary system’s limits as a guarantor of direct democratic choice.


    Evaluating the Primary System: Strengths and Weaknesses

    Judged against the pre-1968 system, in which party bosses chose nominees at conventions before the McGovern-Fraser Commission‘s reforms, the modern primary system has clear democratic advantages, though it carries real costs.

    Strengths
    • Legitimacy: voters, not officials, choose the nominee, giving it a democratic mandate.
    • Transparency: public, state-by-state contests test candidates repeatedly over several months.
    • Rigour: the long calendar forces organisation-building, fundraising and scrutiny, arguably preparing nominees for office.
    • Openness to outsiders: candidates without establishment backing, such as Barack Obama (2008) and Donald Trump (2016), can win by appealing directly to voters.
    Weaknesses
    • Turnout: primary electorates are smaller, older, wealthier and more ideological than the general electorate.
    • Polarisation: appealing to partisan primary voters first is argued to reward more extreme candidates.
    • Sequencing: early, unrepresentative states such as Iowa and New Hampshire hold disproportionate influence.
    • Money and the invisible primary: fundraising and elite endorsement shape outcomes before voters are involved.
    • Cost and fatigue: campaigns can run nearly two years and cost hundreds of millions of dollars, favouring the wealthy and risking voter disengagement.
    • Inconsistency: rules vary by state and party; caucuses, as in Iowa in 2020, are prone to administrative failure.
    • Party control: episodes such as pre-2018 superdelegates and the delegate-driven nomination of Kamala Harris in 2024 show parties can override primary outcomes.
    • Shifting legitimacy claims: candidates behind in delegates often call the rules unfair, then soften once they win, illustrated below.

    During the 2016 Republican contest, as unbound delegate rules in Colorado favoured Ted Cruz, Trump called the process:

    “a rigged, disgusting dirty system”  — Donald Trump, campaign rally, Albany, New York, April 2016

    Once he had won the nomination, his tone shifted:

    “Now I don’t say it anymore because I won.”  — Donald Trump, campaign rally, Charleston, West Virginia, May 2016

    This shift is often cited to show how criticism of primary rules can track a candidate’s fortunes as much as any principled objection.


    The Reform Debate

    Dissatisfaction with the system has produced ongoing reform efforts, from adjustments within the existing framework to proposals abolishing partisan primaries altogether.

    Calendar reform
    • In February 2023 the Democratic National Committee reordered its 2024 calendar, moving South Carolina first, followed by New Hampshire, Nevada, Georgia and Michigan, to better reflect the party’s diversity.
    • New Hampshire refused to move its primary, since state law, not the national party, sets the date, exposing the limits of central control over the calendar.
    Superdelegate reform

    The 2018 DNC rule barring superdelegates from a first-ballot vote answered criticism, chiefly from Bernie Sanders supporters, that party elites held too much sway in 2016. The Republican Party has no equivalent mechanism, though some states retain unbound delegates.

    Structural reform: open and nonpartisan primaries
    • Alaska: adopted a top-four nonpartisan primary with ranked-choice voting in 2020; a repeal narrowly failed in 2024, with another repeal vote set for November 2026.
    • Nevada: approved a top-five ranked-choice model in 2022 but rejected it on the required second vote in 2024, so it did not take effect.
    • Idaho: rejected a similar top-four proposal by roughly 70–30 in 2024.
    • New Mexico, Oklahoma and New York City: New Mexico moved to a semi-closed primary from 2026; Oklahoma and New York City are pursuing open-primary proposals for the 2026 ballot.
    Wider proposals

    Other proposals include:

    • a single national primary day, reducing early-state influence but disadvantaging lesser-known candidates;
    • rotating regional primaries, to balance influence over time;
    • further limits on caucuses, given their low turnout and vulnerability to failure, as in Iowa in 2020.

    None has gained major-party backing; reform remains piecemeal.


    Conclusion

    The American primary system is a still-evolving compromise between popular participation and party control.

    It has opened candidate selection far beyond the convention system it replaced, but does so through a patchwork of state rules, an influential pre-electoral phase shaped by money and elite endorsement, and a sequencing of contests that favours some states over others.

    The 2024 cycle illustrated both tendencies: a compressed, elite-shaped Republican contest resolved within six weeks, and a Democratic nomination ultimately settled by delegates rather than primary voters.

    These tensions continue to drive reform, from calendar changes and the curtailment of superdelegates to more radical experiments with nonpartisan and ranked-choice primaries, the fate of which, as Alaska‘s unresolved position shows, remains genuinely open.


  • 2020 and 2024 US Presidential Elections


    The 2020 election: timeline

    DateEvent
    November 2016Trump defeats Clinton to win the presidency
    November 2018Midterm elections; Democrats retake the House of Representatives
    2019–early 2020Extensive Democratic primary field forms and contests early states
    March 2020Biden emerges as frontrunner after South Carolina; COVID-19 declared a national emergency
    April 2020Sanders withdraws; Biden becomes presumptive Democratic nominee
    25 May 2020Death of George Floyd in Minneapolis triggers nationwide Black Lives Matter protests over the summer
    August 2020Democratic Convention (largely virtual): Biden/Harris ticket confirmed; Republican Convention: Trump/Pence renominated
    September–October 2020Presidential debates held; Trump contracts COVID-19
    18 September 2020Death of Justice Ruth Bader Ginsburg creates a Supreme Court vacancy
    26 October 2020Amy Coney Barrett confirmed to the Supreme Court, days before the election
    October 2020Record levels of early and postal voting owing to the pandemic
    3 November 2020Election day
    7 November 2020Media organisations project a Biden victory
    November–December 2020Trump campaign mounts numerous legal challenges to results; “Stop the Steal” movement grows
    14 December 2020Electoral College formally casts its votes
    5 January 2021Georgia Senate run-offs; Democratic wins give the party an evenly split Senate
    6 January 2021Congressional certification session disrupted by an assault on the Capitol
    7 January 2021Certification completed; Biden confirmed as president-elect
    20 January 2021Biden inaugurated

    The 2024 election: timeline

    DateEvent
    20 January 2021Biden inaugurated, following the 2020 contest
    2021–2023Biden administration pursues its legislative programme; Trump faces four separate criminal indictments
    December 2022Congress passes the Electoral Count Reform Act, closing loopholes exposed on 6 January 2021
    November 2022Midterm elections; Republicans narrowly retake the House
    2023Republican primary field forms; Trump remains dominant despite his legal troubles; Robert F. Kennedy Jr launches an independent presidential bid
    January–March 2024Republican primaries; DeSantis and Haley withdraw; Trump becomes presumptive nominee
    March 2024Biden and Trump both formally clinch their nominations, confirming a rematch
    30 May 2024Trump convicted in the New York hush money trial, the first former president convicted of a felony
    27 June 2024First presidential debate; Biden’s faltering performance triggers a crisis within his own party
    13 July 2024Attempted assassination of Trump at a rally in Butler, Pennsylvania
    15–18 July 2024Republican Convention: Trump/Vance ticket confirmed
    21 July 2024Biden withdraws from the race and endorses Harris
    August 2024Democratic Convention: Harris/Walz ticket confirmed; Kennedy withdraws his independent bid and endorses Trump
    10 September 2024Harris and Trump debate
    1 October 2024Vance and Walz hold the vice-presidential debate
    October 2024Final campaign stretch; heavy early voting
    5 November 2024Election day
    6 November 2024Trump declared the winner
    17 December 2024Electoral College casts its votes
    6 January 2025Congressional certification proceeds peacefully, with Harris presiding in her capacity as vice president
    20 January 2025Trump inaugurated for a second, non-consecutive term

    Analysis: the 2020 election

    • The COVID-19 pandemic remained the dominant fact of the cycle, shaping the primary process and forcing both parties to hold largely virtual conventions.
    • The killing of George Floyd in May 2020 triggered the largest wave of Black Lives Matter protests since the 1960s, pushing racial justice and policing to the centre of the campaign.
    • The death of Ruth Bader Ginsburg in September 2020, and the Senate’s rapid confirmation of Amy Coney Barrett weeks before the election, shifted the Supreme Court decisively rightward and energised both parties’ bases around abortion rights.
    • Biden ran a low-key campaign, limiting in-person events and framing the contest as a referendum on Trump’s competence and temperament rather than a detailed policy platform.
    • Trump continued to hold large rallies despite public health guidance, framing the campaign around cultural and law-and-order themes and casting the summer’s protests as evidence of disorder under Democratic leadership.
    • Right-wing media, led by Fox News, played a significant part in amplifying Trump’s later claims of electoral fraud, reflecting the growing influence of a partisan information ecosystem.
    • Biden won the popular vote by roughly 51.3 per cent to 46.8 per cent (81.3 million votes to 74.2 million) and secured 306 Electoral College votes to Trump’s 232, flipping Michigan, Wisconsin, Pennsylvania, Arizona and Georgia.
    • Turnout reached around 66.6 per cent of the eligible population, the highest in over a century, with more than 159 million Americans voting.
    2020 U.S. Presidential Election Electoral College Results. Source: Wikimedia Commons
    2020 U.S. Presidential Election Electoral College Results. Source: Wikimedia Commons
    • Control of the Senate remained undecided on election night, hinging on Georgia’s two seats, both of which went to run-offs.
    • Trump and his allies pursued dozens of legal challenges to the result, nearly all dismissed for lack of evidence, while pressuring state officials and the Justice Department to intervene.
    • On 5 January 2021, Democrats won both Georgia Senate run-offs, giving the party an evenly split Senate.
    • On 6 January 2021, a crowd of Trump supporters breached the Capitol building in an attempt to disrupt certification of the Electoral College result; Congress reconvened later that day to complete certification.
    • Trump declined to attend Biden’s inauguration on 20 January 2021, breaking with longstanding convention.

    Analysis: the 2024 election

    • Trump’s candidacy proceeded despite four separate criminal indictments and, in May 2024, a conviction on 34 felony counts in the New York hush money trial, making him the first former president convicted of a crime.
    • Biden’s halting performance in the 27 June 2024 debate crystallised concerns about his age and fitness, leading to his withdrawal on 21 July and his endorsement of Kamala Harris.
    • Trump survived an assassination attempt at a rally in Butler, Pennsylvania on 13 July 2024, days before the debate crisis fully unfolded.
    • Robert F. Kennedy Jr’s independent candidacy drew support from disillusioned voters for much of the year before his withdrawal in August 2024 and endorsement of Trump.
    • Harris was elevated to the nomination without a contested primary, selecting Minnesota governor Tim Walz as her running mate.
    • Harris’s compressed fifteen-week campaign emphasised continuity with popular elements of the Biden administration while distancing herself from its less popular aspects, particularly inflation and immigration.
    • The war in Gaza cost Harris support among younger, Arab-American and progressive voters critical of the Biden administration’s stance.
    • The Dobbs decision of 2022 kept abortion rights a central mobilising issue for Democrats throughout the campaign.
    • Trump’s campaign continued its grievance-based and culturally combative style, benefiting from a more disciplined operation and voter dissatisfaction with the cost of living.
    • X, formerly Twitter, under Elon Musk’s ownership, became a significant platform for the Trump campaign, while both campaigns invested heavily in long-form podcast appearances.
    • Trump won 312 Electoral College votes to Harris’s 226 and the popular vote by roughly 49.8 per cent to 48.3 per cent (77.3 million to 75.0 million), the first Republican popular vote win since 2004.
    • Trump swept all seven swing states, Pennsylvania, Wisconsin, Michigan, Georgia, Arizona, Nevada and North Carolina, flipping six of these from Biden’s 2020 column.
    2024 U.S. Presidential Election Electoral College Results. Source: Wikipedia
    • Turnout fell modestly to around 63.7 per cent of the eligible population, still the second-highest level in over a century.
    • Republicans retained the House and regained the Senate, giving the incoming administration unified control of Congress.
    • Harris conceded within a day of the result and, in her role as vice president, presided over the peaceful certification of Trump’s victory on 6 January 2025.
    • The transition featured contentious cabinet nominations, including Matt Gaetz’s withdrawal as attorney-general nominee and Robert F. Kennedy Jr’s nomination to lead health policy.
    • Elon Musk played a prominent, unofficial role in shaping the incoming administration’s approach to federal spending and personnel.
    • Trump was inaugurated for a second, non-consecutive term on 20 January 2025.

    Comparing the two cycles

    • Both elections were shaped by shocks from outside the actual election process: the pandemic and Black Lives Matter protests in 2020; an assassination attempt and a late candidate substitution in 2024.
    • Both featured serious questions about a candidate’s fitness: Trump’s conduct and legal jeopardy in 2020, Biden’s age and capacity in 2024.
    • The Electoral Count Reform Act, passed in December 2022, raised the objection threshold, clarified the vice president’s ceremonial role, and designated governors as responsible for certifying electors, directly addressing the ambiguities exploited on 6 January 2021.
    • The 2024 transition was peaceful and uncontested, in sharp contrast to 2020, raising the question of whether this reflects a genuine restoration of democratic norms or simply Trump’s victory removing his incentive to contest the result.

    Extension Reading

    2024 Electoral College Results, National Archives: https://www.archives.gov/electoral-college/2024

    Behind Biden’s 2020 Victory, Pew Research Center: https://www.pewresearch.org/politics/2021/06/30/behind-bidens-2020-victory/

    Voter turnout in the 2020 and 2024 elections, Pew Research Center: https://www.pewresearch.org/politics/2025/06/26/voter-turnout-2020-2024/

    Understanding the Electoral Count Reform Act of 2022, Protect Democracy: https://protectdemocracy.org/work/understanding-the-electoral-count-reform-act-of-2022/


  • Presidential Election Cycle


    Constitutional requirements

    The Constitution supplies only the bare skeleton of the presidential election process: who may stand, how electors are appointed, and when terms begin and end. The primaries, caucuses and national conventions described in the next section appear nowhere in its text; they are practices developed by the political parties over time, not constitutional or statutory requirements.

    • Article II, Section 1 establishes the presidency, sets a four year term, and creates the Electoral College as the selecting mechanism: each state appoints electors equal to its total congressional representation (House seats plus two senators), with the manner of appointment left to state legislatures.
    • Eligibility criteria under the same section: a candidate must be a natural born citizen, at least thirty five years of age, and resident within the United States for a minimum of fourteen years.
    • Elector allocation is left to the states: forty eight states and the District of Columbia use a winner takes all system, while Maine and Nebraska allocate electors partly by congressional district, known as the congressional district method.
    • Twelfth Amendment (1804) introduced after the disputed election of 1800, when Thomas Jefferson and his running mate Aaron Burr tied in the Electoral College. It requires electors to cast separate ballots for president and vice president, still governing how the College operates today.
    • Faithless electors, who depart from their state’s popular vote result, have occasionally occurred. The Supreme Court confirmed in Chiafalo v Washington (2020) that states may bind electors to the popular result and penalise those who do not comply.
    • Divergence from the popular vote has occurred five times: in 1876, 1888, 2000 and 2016 the Electoral College winner lost the national popular vote, and in 1824 no candidate secured an Electoral College majority, so the House of Representatives elected John Quincy Adams despite Andrew Jackson leading in both measures. The most recent instance was 2016, when Donald Trump won the Electoral College while losing the popular vote to Hillary Clinton by nearly three million votes.
    • Twentieth Amendment (1933) fixed the inauguration date at 20 January and shortened the transition period between election and the assumption of office.
    • Twenty Second Amendment (1951) limits a president to two elected terms, passed after Franklin Roosevelt’s four terms in office.
    • Donald Trump has repeatedly floated the idea of a third term, including musing at a 2026 correspondents’ dinner and donning a “Trump 2028” cap, as well as a mooted workaround of running as vice president alongside JD Vance before an assumption of office. Having already served two terms (2017 to 2021 and from 2025), such a bid is constitutionally barred under the Twenty Second Amendment; Trump himself has acknowledged this, stating the text is “pretty clear” that he is “not allowed to run.”
    • Twenty Fifth Amendment (1967) sets out procedures for presidential succession and incapacity, relevant where a vacancy arises mid term.

    Timeline of the electoral process

    StageApproximate timingKey eventsConstitutional / legal basis
    Invisible primary12–18 months before electionFundraising and exploratory PAC formation, early state visits, no formal declaration; official campaign committees are regulated by the Federal Election Commission (FEC), while nominally independent Super PACs face no contribution limitsNo formal basis for the process itself; fundraising activity governed by the Federal Election Campaign Act (FECA)
    Formal declarationsSpring of the year before the electionCandidates announce campaigns—
    Primaries and caucusesJanuary–June, election yearStaggered state contests, opening with Iowa and New Hampshire; delegates allocatedState law; party rules
    National conventionsSummer, election yearPresidential and vice presidential candidates formally confirmed—
    General election campaignConventions to NovemberNationwide campaigning—
    Election DayTuesday after the first Monday in NovemberVoters choose pledged electors, not the candidate directlyFederal statute
    Electors voteDecember, election yearState electors formally cast votes for president and vice presidentTwelfth Amendment
    Congressional count6 January, year after election (moves to 7 January if the 6th is a Sunday)Congress counts and certifies electoral votesSet by statute, not the Constitution: 3 U.S.C. § 15, as amended by the Electoral Count Reform Act 2022; Congress may alter the date by law
    Inauguration20 January, year after election, at noonPresident elect assumes office; if 20 January falls on a Sunday, the oath is taken privately that day and the public ceremony held 21 JanuaryTwentieth Amendment (the noon 20 January term start is constitutionally fixed and does not move)

    Current position in the cycle (July 2026)

    • Stage: invisible primary for the 2028 election, roughly twenty seven months before polling day in November 2028.
    • No candidate from either major party has formally declared a campaign; declarations are generally expected from late 2027 into early 2028.
    • Republican side: Vice President JD Vance is widely regarded as the presumptive front runner, given his position as sitting vice president.
    • Democratic side: no clear front runner has emerged. Figures frequently discussed include Kamala Harris, Gavin Newsom, Josh Shapiro and Alexandria Ocasio-Cortez, alongside preparatory activity from senators such as Jon Ossoff.
    • 2026 midterm elections (this coming November) will shape the field considerably before the invisible primary matures: the full House, roughly a third of the Senate, and numerous governorships are contested.
    • Significance: midterm results conventionally serve as a referendum on the incumbent administration and tend to elevate or diminish potential 2028 contenders holding office, so the current landscape is best understood as provisional.

    Glossary of key terms

    • Electoral College: the body of electors, one per state congressional seat plus three for the District of Columbia, that formally elects the president and vice president.
    • Elector: an individual appointed by a state to cast that state’s electoral votes.
    • Invisible primary: the informal period of fundraising, positioning and organisation before any candidate formally declares.
    • Primary: a state level contest in which party voters choose delegates pledged to a candidate.
    • Caucus: a local party meeting, rather than a ballot, used in some states to allocate delegates.
    • Delegate: a party representative who formally nominates a candidate at the national convention.
    • Superdelegate: an unpledged party or elected official delegate, used mainly by the Democratic Party, free to support any candidate.
    • Faithless elector: an elector who votes contrary to their state’s popular result.
    • Safe harbor deadline: the statutory date by which states must resolve election disputes for their results to be treated as conclusive by Congress.

    Conclusion

    The presidential election process combines a short, fixed constitutional skeleton with a much longer, informally organised political process built up by the parties over two centuries.

    The Constitution and its amendments settle the essentials: who may stand, how electors are appointed and counted, and precisely when one term ends and the next begins.

    Everything that fills the intervening two years, from the invisible primary through to the national conventions, rests on party convention and state law rather than the constitutional text itself.

    As of July 2026, the country sits at the very start of that longer process for 2028, with the shape of the field still substantially dependent on the outcome of this coming November’s midterm elections.


    Sources and further reading